Figure 8.

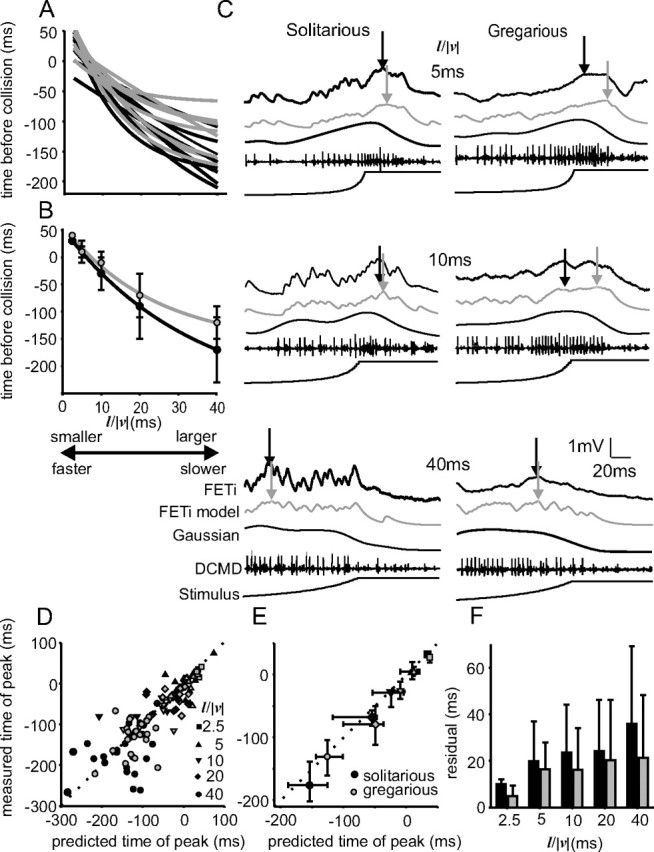
There is a nonlinear relationship between the time of compound PSP maximum and l/|v|, which differs between phases. A, Nonlinear regressions of the form of time of peak PSP amplitude relative to collision against l/|v| (black lines, solitarious locusts; gray lines, gregarious locusts). B, Mean regressions from the data in A. C, Recordings from solitarious (left column) and gregarious (right column) locusts showing actual (black) and predicted (gray) model values of time of maximum PSP. Arrows indicate maxima. D, E, Measured versus predicted times of compound PSP peak amplitude. D shows all of the data, and E shows the medians and interquartile ranges. F, The magnitudes of the residuals (errors) between observed and predicted PSP peak times increased with l/|v| and was greater in solitarious locusts (black bars) than in gregarious locusts (gray).
