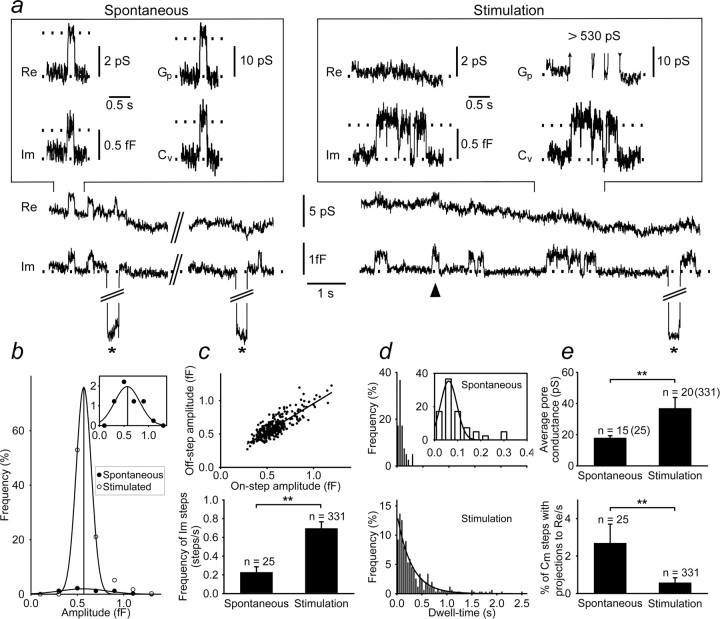
Figure 6.
Fusion pore openings in cell-attached patches of a lactotroph before and after stimulation. a, Examples of Re and Im traces under spontaneous and 100 mm KCl-stimulated conditions. Im exhibits reversible step increases under spontaneous and stimulated conditions. Note the significant cross talk between the Im and the Re signals under spontaneous conditions, which diminished after stimulation (arrowhead). The calibration pulse (asterisk, 10 fF) does not project to the Re signal, indicating the correct phase angle setting of the lock-in amplifier. Expanded segments show individual transient events before and after stimulation. Also shown are Gp and Cv calculated from Im and Re (see Materials and Methods). Insets on the right indicate fusion pore opening in which Gp was likely >530 pS (maximal Gp measured), because a change in Re was not associated with the Im signal of the transient fusion pore event. b, Distribution of amplitudes of transient capacitance fusion events before and after stimulation. The curves show Gaussian fits with the mean values: 0.57 ± 0.05 fF (n = 25) for spontaneous events and 0.57 ± 0.04 fF (n = 331) for stimulated events (p = 0.998). The inset shows the distribution of spontaneous events on an expanded ordinate scale. c, Occurrence of transient fusion events. A plot of capacitance on-steps versus off-steps (top) revealed a high correlation coefficient (r) between the two measures (r = 0.82). The line represents the linear fit to the data with a slope near 1 (0.85 ± 0.03; n = 356). The frequency of events (bottom), analyzed in 10 s epochs, increased from 0.23 ± 0.06 events/s (n = 25 events analyzed in 18 epochs) to 0.70 ± 0.07 events/s (n = 331 events analyzed in 55 epochs). d, Fusion pore dwell-time histograms under spontaneous and stimulated conditions. Frequency distribution of fusion pore dwell times in spontaneous events was best fitted with a Gaussian curve with the mean ± SEM: 62 ± 2 ms (n = 25). After stimulation, the frequency distribution was best fitted with a single-exponential curve with the time constant of 287 ± 0.02 ms (n = 331). e, Gp analysis of transient events calculated from Re and Im. Top, The average Gp increased from 18 ± 1 pS (n = 15) to 37 ± 7 pS (n = 20). Excluded are 10 spontaneous and 311 stimulated events that did not exhibit cross talk between the Im and Re traces. Bottom, The occurrence of transient events with cross talk between Im and Re traces was determined as percentages of events per second, analyzed in 10-s-long epochs (18 before and 55 after stimulation). Their occurrence decreased from 2.7 ± 1.0%/s (n = 25) at rest to 0.6 ± 0.3%/s after stimulation (n = 331). All diagrams apply to a representative experiment. Values are means ± SEM. **p < 0.05.

