
Figure 2.
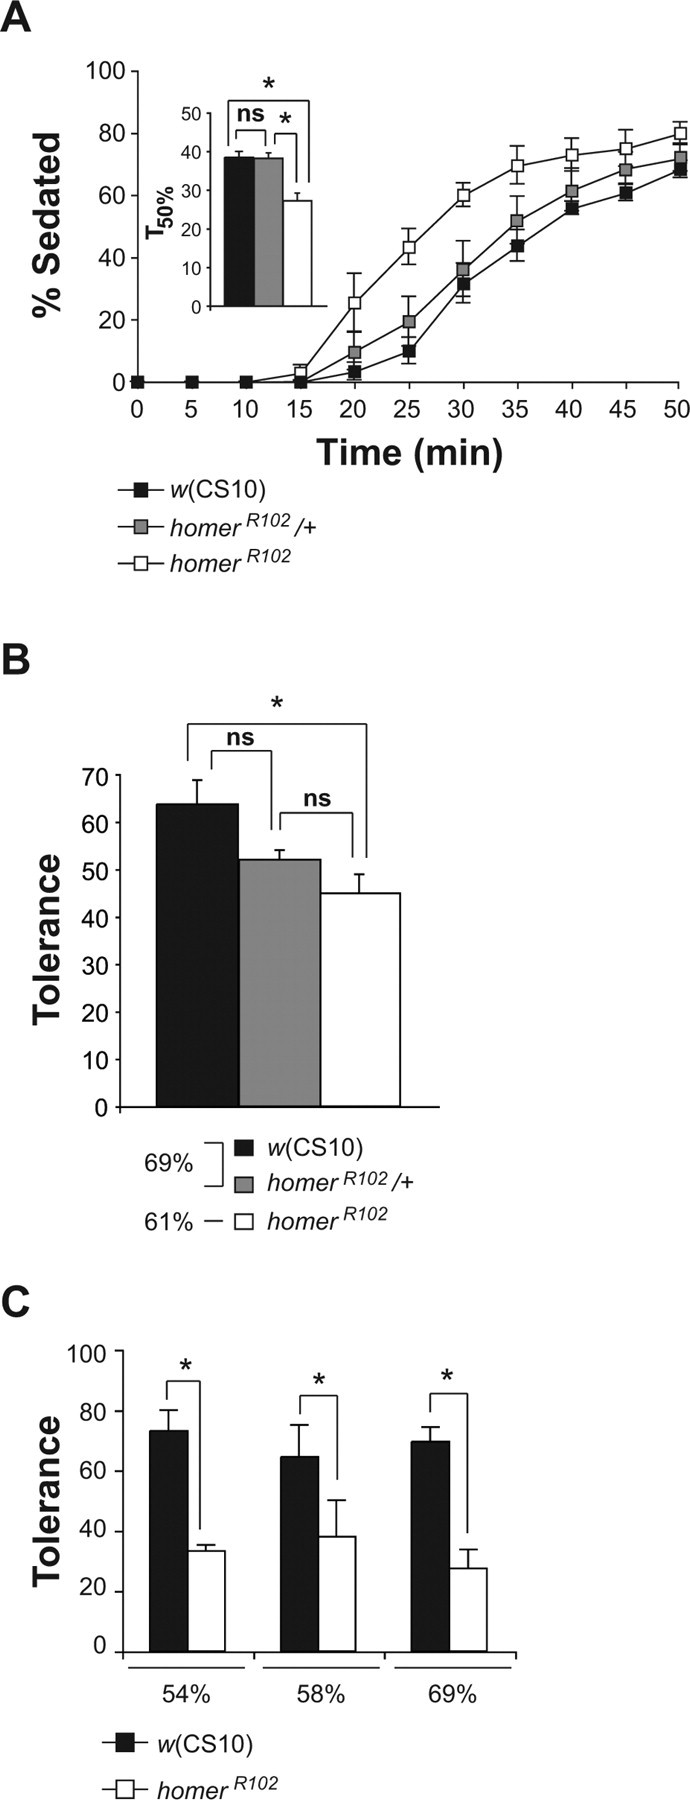
Increased ethanol sensitivity and impaired rapid tolerance of homerR102 mutant flies. A, The homerR102 mutants exhibited increased and recessive sensitivity to the sedative effects of ethanol vapor. Using a best-fit function, the time at which 50% of the flies were sedated (T50%) using 56% ethanol vapor was calculated for each of the genotypes. The T50% of the homerR102 flies was significantly different from the T50% of the w(CS10) and homerR102/+ flies as measured by a one-factor ANOVA, followed by post hoc analysis using the Bonferroni/Dunn test (n = 4; *p < 0.0167). B, The homerR102 mutants developed significantly less rapid ethanol tolerance than control w(CS10) flies, whereas the homerR102/+ flies developed rapid tolerance that was not significantly different from either the w(CS10) or the homerR102 flies. Because flies of the different genotypes exhibited differences in sensitivity, the w(CS10) and homerR102/+ flies were exposed to a higher ethanol vapor concentration than homerR102 flies so that the initial percentage of sedation would be normalized among groups. The w(CS10) flies showed a 64% decrease in the number of flies sedated during the second treatment, whereas the homerR102 flies showed a 45% decrease. The asterisk indicates significant differences as determined by a one-factor ANOVA, followed by post hoc analysis with the Bonferroni/Dunn test (n = 5, *p < 0.0167). C, The impairment of rapid tolerance is independent of the ethanol vapor concentration used to induce rapid tolerance. At three ethanol concentrations tested, the percentage of flies sedated at the end of the second exposure was significantly less than the percentage of flies sedated at the end of the first exposure for both genotypes. At each of the concentrations used to induce rapid tolerance, the w(CS10) control flies exhibited a 70% decrease in the percentage of flies sedated during the second ethanol exposure, whereas the homerR102 mutant flies displayed only a 30% decrease with significance determined by t tests (n = 4; *p < 0.01). Error bars indicate SEM. ns, Not significant.