Figure 4.
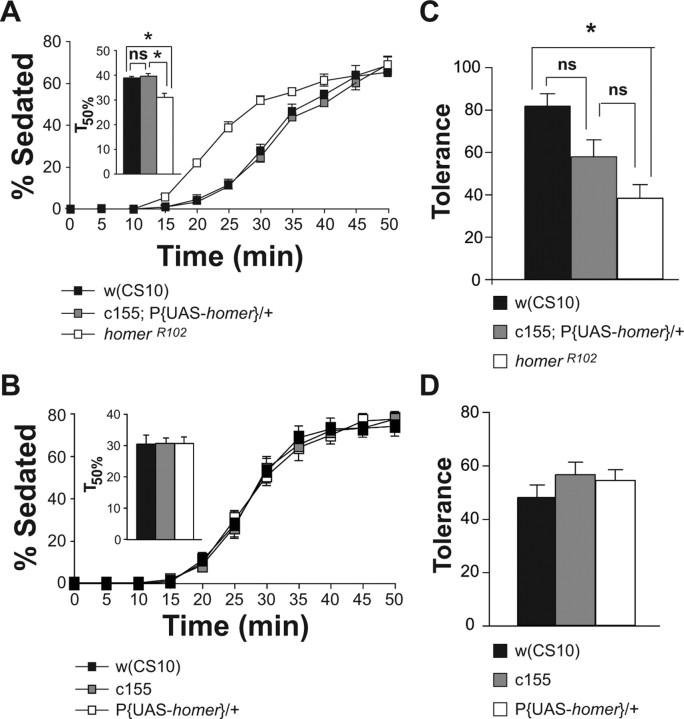
Flies overexpressing Homer develop normal sensitivity and rapid ethanol tolerance. A, The ethanol sensitivity of w(CS10) flies carrying the pan-neuronal driver c155-GAL4 and the P{UAS-homer-myc} transgene was not significantly different from w(CS10) flies. The T50% of the c155-GAL4;P{UAS-homer-myc} flies was not significantly different from the T50% of the w(CS10) flies but was significantly different from the T50% of the homerR102 flies, as measured by one-factor ANOVA and post hoc Bonferroni/Dunn comparisons (n = 4; *p < 0.0167). B, The ethanol sensitivity of w(CS10) flies carrying the c155-GAL4 driver or the P{UAS-homer-myc) transgene alone was not significantly different from the w(CS10) flies. No significant differences were observed between the T50% of the w(CS10), c155-GAL4, and P{UAS-homer-myc} flies as determined by a one-factor ANOVA and Bonferroni/Dunn comparisons (n = 4). C, The w(CS10) flies carrying the pan-neuronal driver c155-GAL4 and the P{UAS-homer-myc} transgene displayed intermediate rapid tolerance compared with w(CS10) and homerR102 control flies. The asterisk indicates significant differences as determined by a one-factor ANOVA and post hoc Bonferroni/Dunn comparisons (n = 5; *p = 0.0167). D, No significant differences in the development of rapid tolerance were observed between the w(CS10), c155-GAL4, and P{UAS-homer-myc} flies as determined by a one-factor ANOVA and post hoc Bonferroni/Dunn comparisons (n = 4). Error bars indicate SEM. ns, Not significant.

