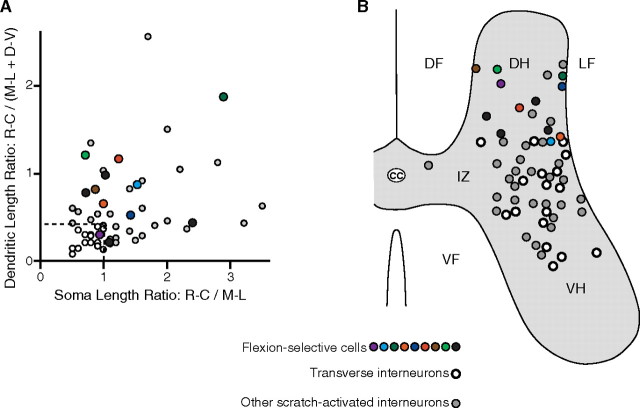
Figure 7.
Summaries of morphological features of flexion cells. A, Graph of dendritic length ratios versus soma length ratios for all flexion cells (colored and black circles), compared with T neurons (white circles) and other scratch-activated interneurons (gray circles). B, Soma locations for all flexion cells, marked on a schematic cross section and compared with soma locations of T neurons and other scratch-activated interneurons [data on scratch-activated interneurons are from Berkowitz et al. (2006)]. Colors indicate identities of flexion cells shown in previous figures. D-V, Dorsoventral; M-L, mediolateral; R-C, rostrocaudal; cc, central canal; DF, dorsal funiculus; DH, dorsal horn; IZ, intermediate zone; LF, lateral funiculus; VF, ventral funiculus; VH, ventral horn.

