
Figure 6.
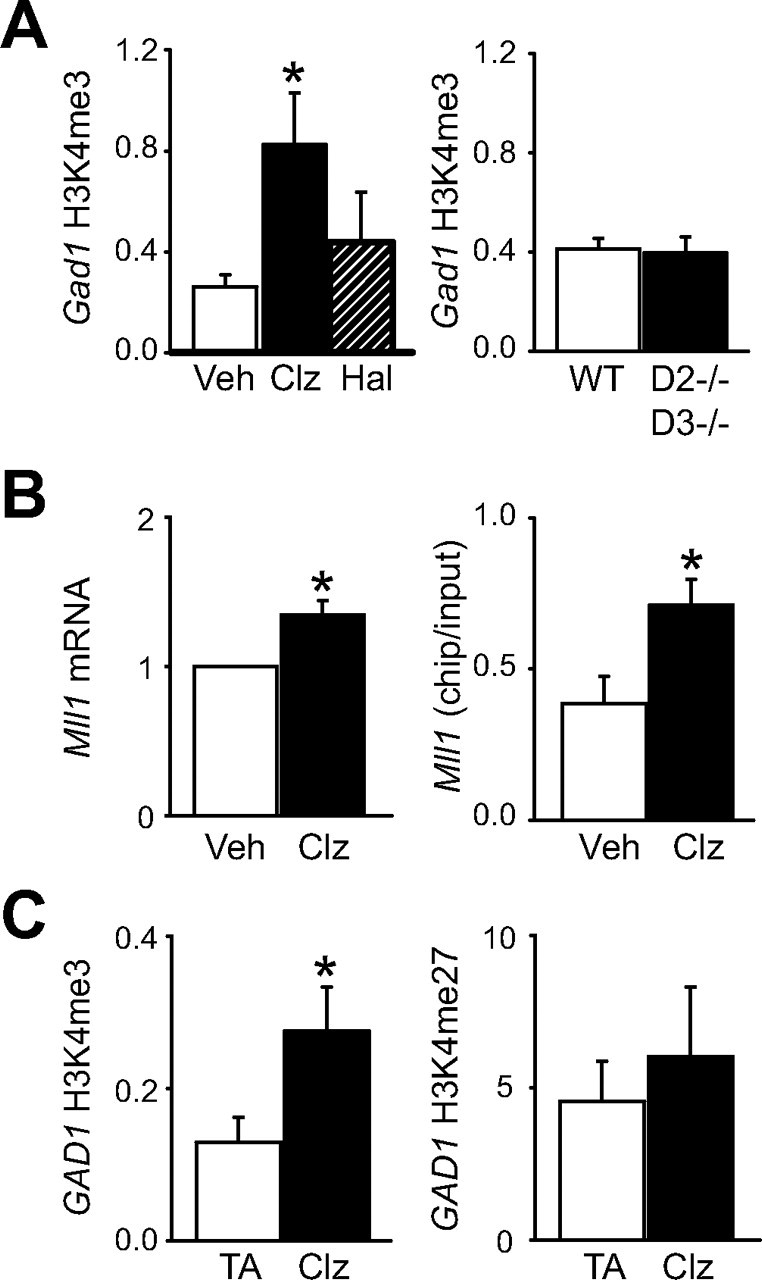
Histone methylation at Gad1/GAD1 locus is positively regulated by the antipsychotic clozapine. A, Bar graphs for mouse cerebral cortex showing H3K4me3 levels at Gad1 promoter. Left graph, Wild-type mice after 3 weeks of daily injections of 5 mg/kg clozapine (Clz) (black bar), 0.5 mg/kg haloperidol (Hal) (shaded bar), or vehicle (white bar); right graph, Drd2 −/− Drd3 −/− double null mutant and control mice. B, Graphs show cortical Mll1 mRNA expression after chronic treatment (left) and Mll1 occupancy at GAD1 promoter (right) in cortex of mice after a single dose of clozapine or vehicle. Data are expressed as mean ± SEM after normalization to housekeeping gene, β2-microglobulin (B2m); N = 6–24/treatment or genotype. C, Bar graphs showing levels of H3K4me3 (left) and H3K27me3 (right) at GAD1 locus in subjects treated with clozapine before death (black bars), relative to B2M housekeeping gene and compared with subjects treated with a typical antipsychotic (TA) (white bars). Notice significant, more than twofold increase in H3K4me3 in clozapine-treated cohort (N = 9). *p < 0.05, one-way ANOVA or Wilcoxon's signed-rank test.