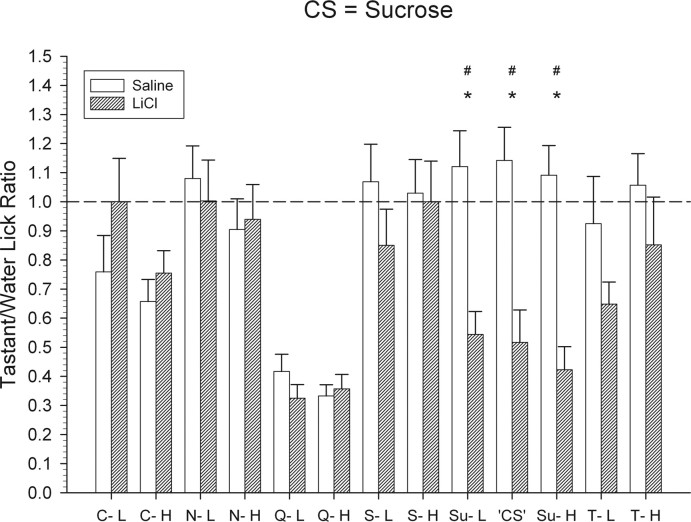
Figure 10.
Mean ± SEM tastant/water lick ratios for the sucrose CS group for all test stimuli. The tastant/water lick ratio was calculated by dividing an animal's average licks to a given taste stimulus across trials by the average licks to water. The dashed line on the graph represents a tastant/water lick ratio of 1.0, which indicates licking to the taste stimulus was equivalent to licking to water. *Significant difference between the tastant/water lick ratios of the control and the conditioned groups.#Significant difference that survives the Bonferroni's α adjustment. C-L, 6.25 mm citric acid; C-H, 13.25 mm citric acid; N-L, 0.175 m NaCl; N-H, 0.375 m NaCl; Q-L, 0.325 mm QHCl; Q-H, 0.625 mm QHCl; S-L, 0.4 m l-serine; S-H, 1.0 m l-serine; Su-L, 0.2 m sucrose; Su-H, 0.6 m sucrose; T-L, 0.175 m l-threonine; T-H, 0.7 m l-threonine; CS, 0.4 m sucrose.

