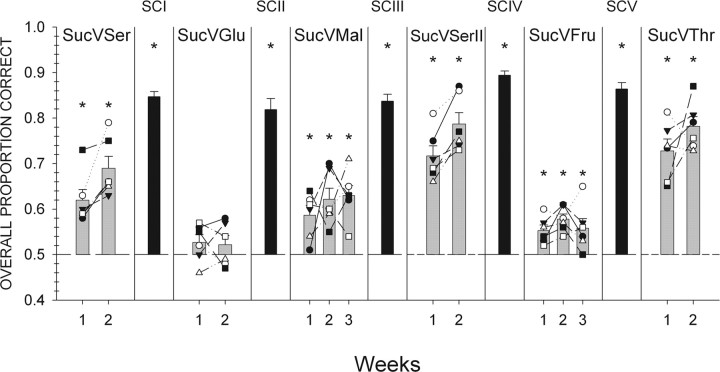
Figure 2.
Individual animal (symbols) and group mean ± SEM (gray bars) data are plotted across all test phases for mice initially trained to discriminate sucrose from NaCl. Black bars denote mean ± SEM performance during the last week of a stimulus control session (±SEM). Performance on all trials with a response is depicted collapsed across all stimuli during 1 week. *Statistically significant deviation from chance performance. Suc, Sucrose; Ser, l-serine; Glu, glucose; Mal, maltose; Fru, fructose; Thr, l-threonine.

