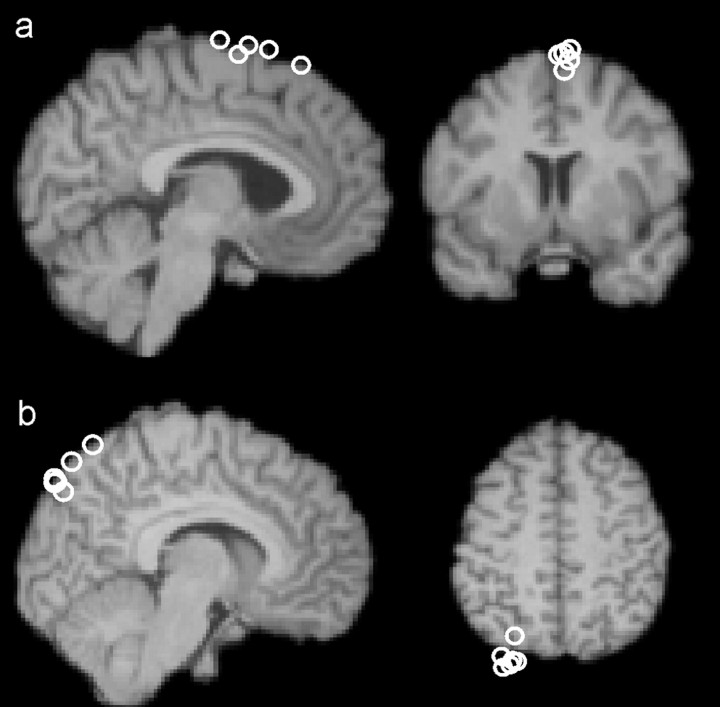
Figure 2.
a, Left dMFC TMS site. The circles represent the MNI coordinates at which TMS was applied over left dMFC in a subset of the subjects from experiment 1 (mean, x = −5, y = 7, z = 73). The circles are superimposed over the brain of an example subject that had also been registered into MNI space. The site is just left of the midline and over tissue normally assigned to the pre-SMA. b, The circles represent the MNI coordinates at which TMS was applied over the control site in a subset of the subjects from experiment 2 (mean, x = −6, y = −81, z = 52).

