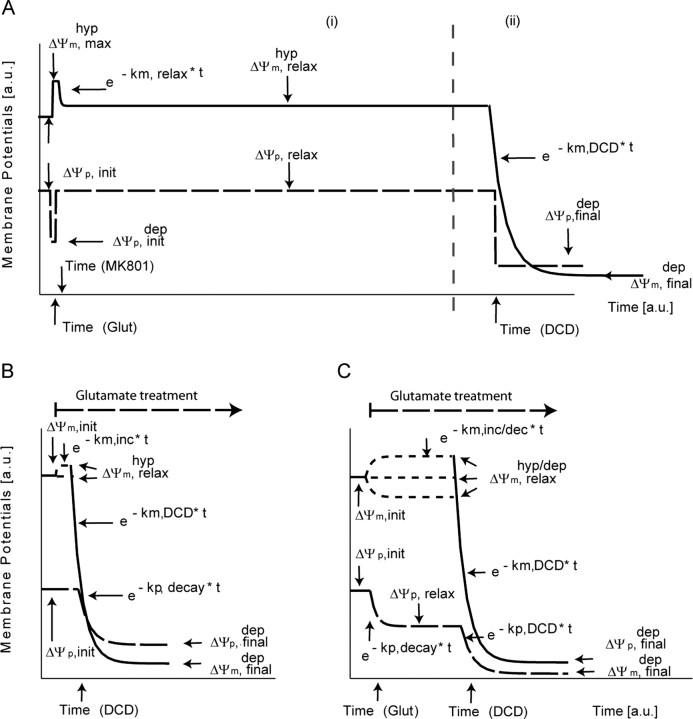
Figure 1.
Potential models and fitting parameters for MATLAB-based analysis. The figure depicts the assumed functional behavior of ΔΨm (solid line) and ΔΨp (dashed line) that is used for fitting the TMRM fluorescent responses as taken from biological assumptions described in Materials and Methods. Parameters subject to fitting (potential values, decay constants) are indicated by arrows. A, Potential model for the apoptotic cells showing hyperpolarizion of ΔΨm only (i) and showing hyperpolarization of ΔΨm with a secondary collapse (ii). B, Necrotic model; monophasic response. C, Necrotic model; biphasic response. a.u., Arbitrary units; hyp, hyperpolarizion; max, maximum; dep init, initial depolarization; dep final, final depolarization; inc, increase; dec, decay; Glut, glutamate; DCD, delayed calcium deregulation.

