Figure 2.
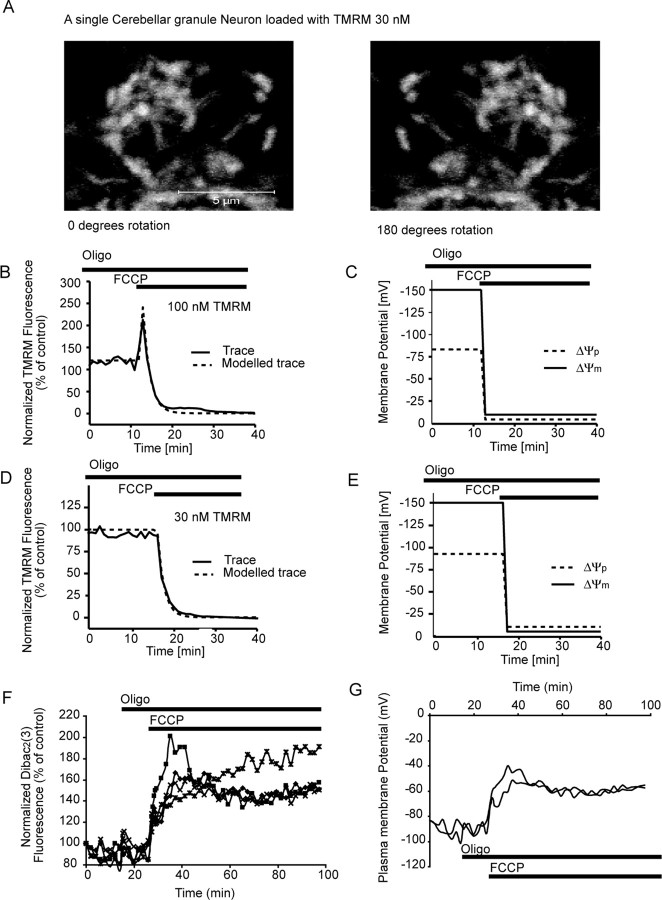
Characterization of TMRM fluorescence in cerebellar granule neurons with high-resolution single-cell confocal microscopy. A, Cerebellar granule neurons were loaded with 30 nm TMRM, and the mitochondrial volume (17.6 ± 1.5 μm3; 6.2 ± 0.8%; n = 9) was determined by measuring the volume of individual mitochondria within the neurons after the acquisition of high-resolution z-stacks with an LSM 510 confocal microscope. B, D, Neurons loaded with 100 nm TMRM (B) and 30 nm TMRM (D) were exposed to FCCP (2 μm) in the presence of oligomycin (2 μg/ml) and monitored over a 60 min period. C, E, Using MATLAB software, the traces in B and D were modeled, and the changes in both ΔΨm and ΔΨp were established for these control experiments (all experiments were performed 3 times in different cultures). F, Cerebellar granule neurons were loaded with the ΔΨp-sensitive probe DiBAC2(3) (1 μm) and exposed to oligomycin (2 μg/ml), followed by FCCP (2 μm). A rapid increase in fluorescence (depolarization of ΔΨp) was associated with the addition of FCCP (traces are representative of those obtained from 3 separate experiments). G, Representative traces for modeled changes in ΔΨp (A) for neurons exposed to oligomycin (2 μg/ml) and FCCP (2 μm). Oligo, Oligomycin.

