Figure 7.

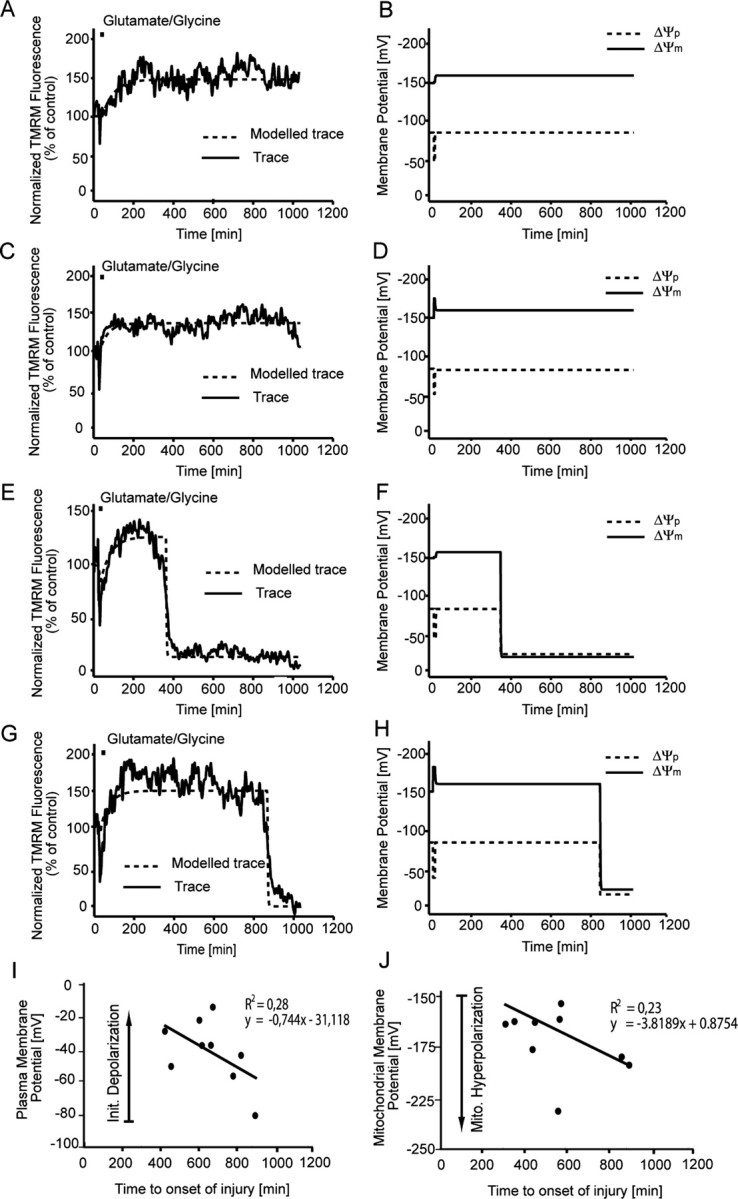
Computational modeling of TMRM traces for cerebellar granule neurons after transient glutamate excitation. Cerebellar granule neurons plated on Willco dishes were loaded with 30 nm TMRM and exposed to glutamate/glycine (100 μm/10 μm) for 5 min. TMRM fluorescence was then monitored over time, and images were taken at 5 min intervals. A, C, Representative TMRM fluorescent traces (solid line) and fitted traces (dashed lines) for neurons that undergo apoptosis after transient glutamate excitation. E, G, Representative TMRM fluorescent traces and fitted traces for neurons that do not undergo apoptosis after transient glutamate excitation. B, D, F, H, Modeled changes in both ΔΨp (dashed lines) and ΔΨm (solid line) for the fitted traces in A, C, E, and F, respectively. TMRM traces (A, C, E, G) are representative of traces obtained from eight separate experiments from different cultures. I, The fitted initial depolarization of ΔΨp during glutamate excitation is plotted against the onset of injury (collapse of TMRM signal; n = 5 populations of neurons). J, The fitted maximum mitochondrial hyperpolarization of ΔΨm against onset of injury after glutamate excitation (n = 5 populations of neurons).
