
Figure 5.
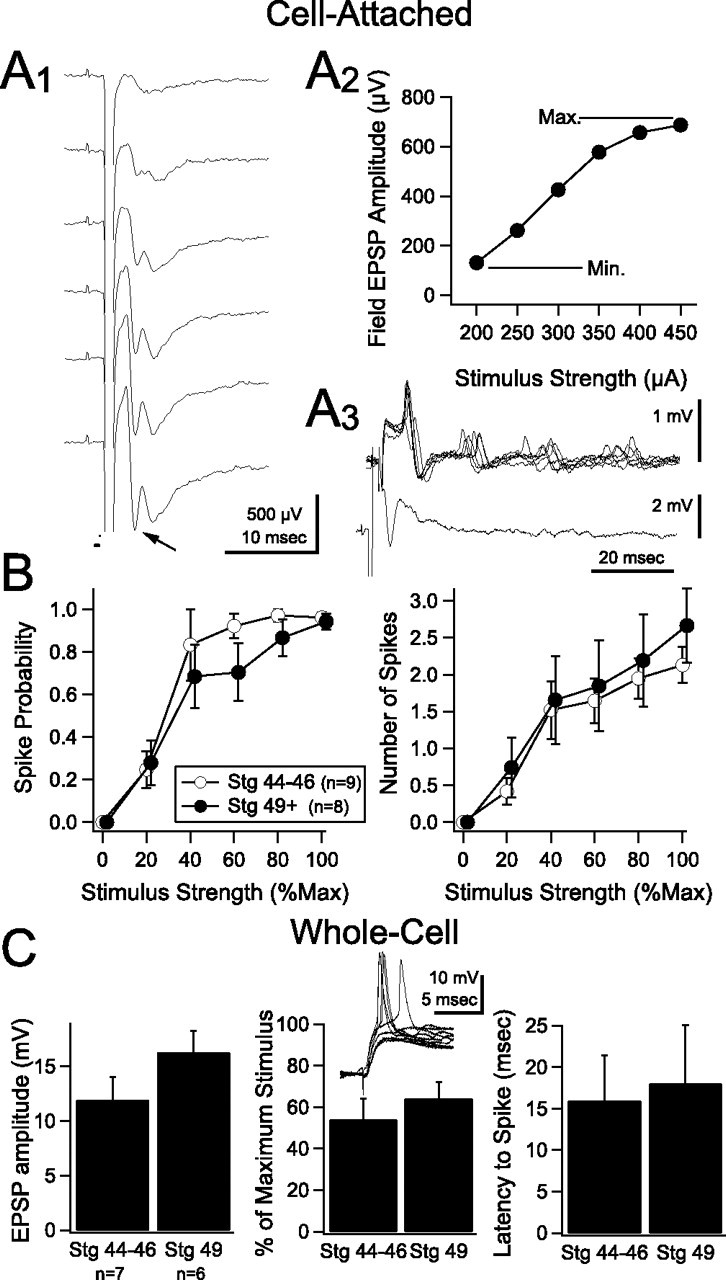
Functional consequences of maintaining stable input–output properties throughout stages 44–46 and 49. A1, An example of a field potential recording in response to increasing stimulation of RGC axons. The first negative-going peak (see arrow) is the monosynaptic RGC response. A2, Field potential amplitude is plotted as a function of stimulus strength and used to identify minimum (Min.) and maximum (Max.) stimulus intensities for each experiment (see Results). A3, Superimposed sweeps from a cell-attached recording showing spikes in response to RGC stimulation (top trace) and corresponding simultaneous field potential recording (bottom trace). B, Average spike probability (left) and number of evoked spikes (right) versus normalized stimulus strength for stage 44–46 and stage 49 tectal neurons. Curves from both developmental stages do not show significant differences. C, Average data obtained from whole-cell current-clamp recordings in response to a paired synaptic stimulus (see Results). Left, Compared with stage 44–46 (n = 7), stage 49 (n = 6) tectal neurons showed a tendency toward requiring a larger absolute EPSP to spike 50% of the time. Middle, When the EPSP amplitude is expressed as percentage of the maximal response for that cell, as shown in B, there are no significant differences between stages. Right, There were no significant differences in latency to spike. The inset shows an example of a whole-cell current-clamp recording from a tectal neuron that is being driven repeatedly at its threshold stimulus intensity. At this stimulation intensity, the cell is firing an action potential ∼50% of the time. Stg, Stage.