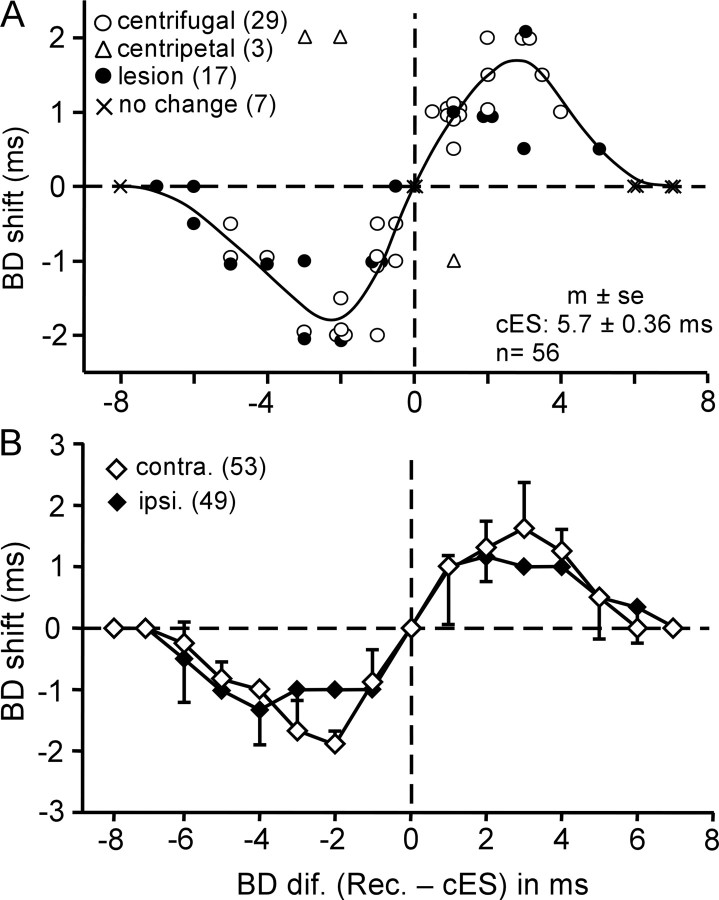
Figure 4.
A, Distribution of BD shifts as a function of BD differences between the recorded FM–FM (Rec.) and electrically stimulated contralateral FM–FM neurons (cES). Open circles and triangles, Centrifugal (n = 29) and centripetal (n = 3) BD shifts measured in the normal bats, respectively. Filled circles, BD shifts (n = 17) measured in the bats with a lesioned collicular commissure. ×, No BD shifts (n = 7; 5 BD-unmatched neurons and 2 BD-matched neurons). The curve was obtained by averaging the data points at each BD difference and then two-point smoothing. B, The BD shifts of FM–FM neurons evoked by electric stimulation of ipsilateral (ipsi.; filled diamonds) and contralateral (contra.; open diamonds) FM–FM neurons. Each data point indicates a mean and SE. The numbers in the parentheses indicate the numbers of neurons from which the data were obtained. The data shown with the filled diamonds were obtained from the study by Xiao and Suga (2004).

