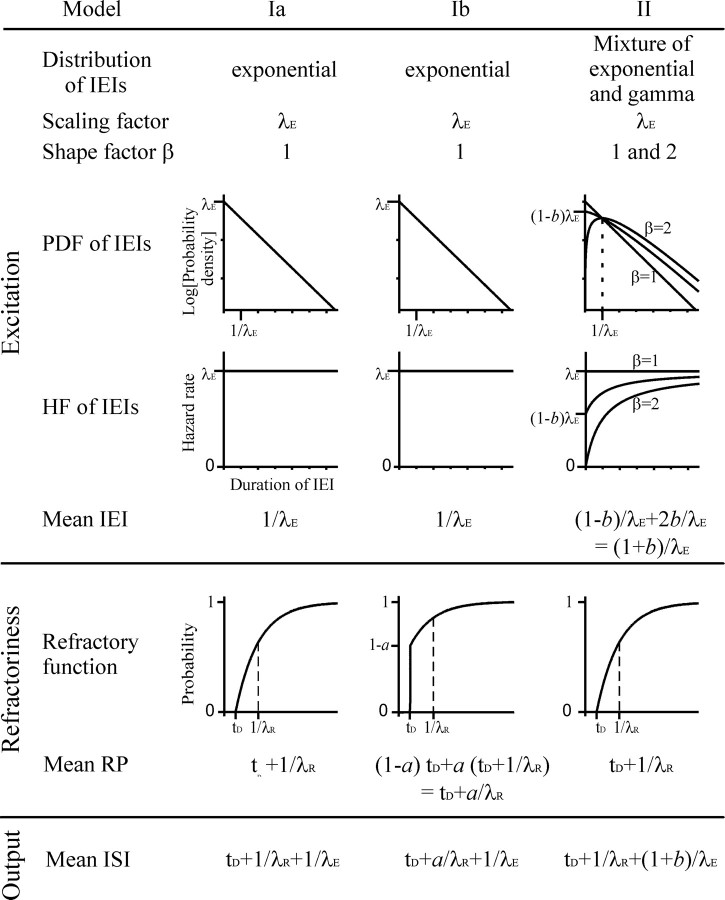
Figure 1.
Some characteristic features of the models for the distribution of ISIs examined here. Models Ia and Ib assume that the distribution of the IEIs is exponential; model II assumes that it is a mixture of an exponential and a gamma distribution. The scaling factor, λE, the shape factor (β), the PDF, the HF, and the mean IEI for each model are shown in the top block (excitation). Note that the PDF, with probability density plotted along a logarithmic axis, is curved, and the HF is monotonically rising when the distribution of IEIs is gamma (β = 2) or when it is a mixture of an exponential (β = 1) and a gamma distribution (center line in the two panels at right), whereas the PDF forms a straight line and the HF is constant when the distribution is exponential (β = 1). Each excitatory event is thought to result in a spike of the afferent fiber unless the fiber is refractory. The refractory functions of the three models are shown in the center block (refractoriness). The bottom row identifies the mean ISI of each model (output). See Results for additional explanations.

