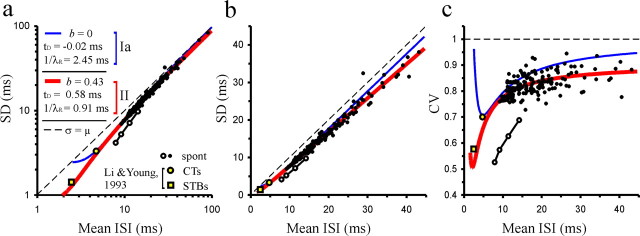
Figure 10.
Constant values of t D, 1/λR, and b can explain the tight relationship between SD and mean ISI across fibers. a, Scatterplot of the SD versus the mean ISI for 186 samples of spontaneous (spont) activity with >400 ISIs. b, Same as a, but with linear axes and restricted to values of SD and mean <45 ms for higher resolution. c, Plot of CV against mean ISI. In all three panels, the red and blue lines show the relationships expected with models II and Ia, respectively, if t D, 1/λR, and b were constant across AN fibers and were as identified in a. The two yellow data points are from the study of cat AN fibers by Li and Young (1993) and represent the fibers with the highest driven rates to CTs or STBs, respectively. Note that model II, but not model Ia, predicts these points correctly and fits the data from the present study very well. Four data points from a single, extraordinary AN fiber with relatively long minimum ISI (open circles) deviate conspicuously from the tight relationship between SD and mean ISI formed by the others (black circles). See Results for details.

