
Figure 2.
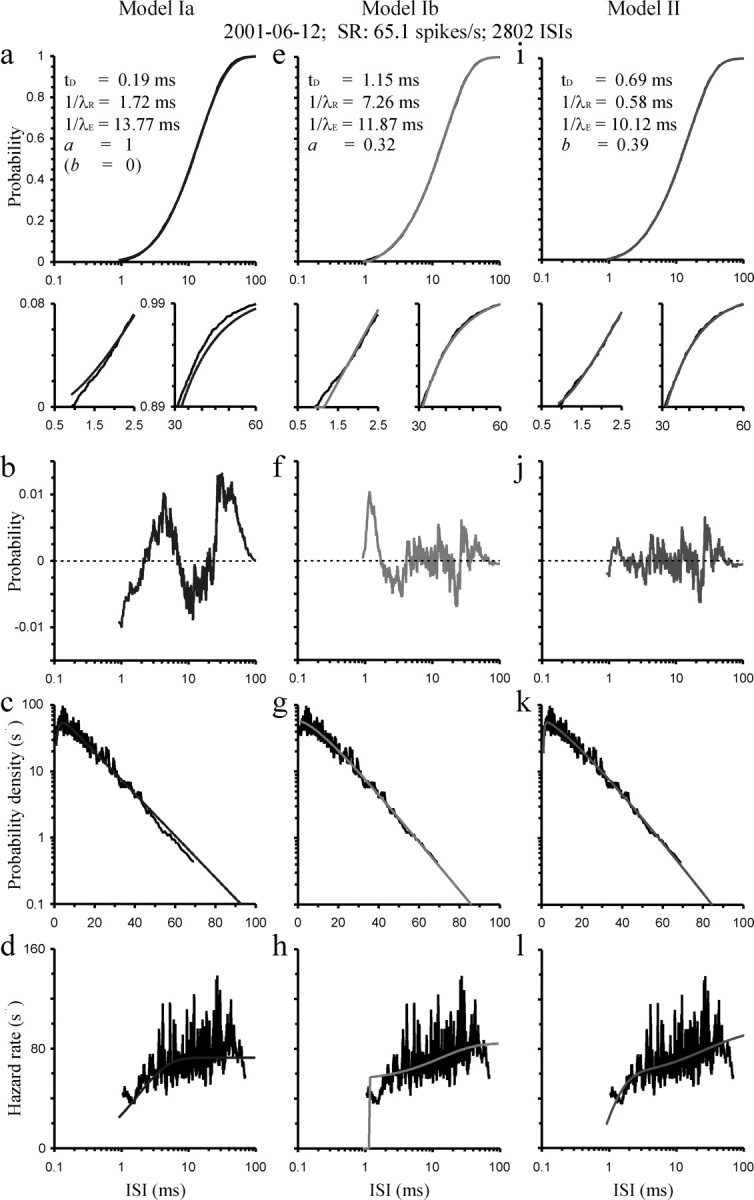
a–l, Fit of models Ia (a–d; left column), Ib (e–h; center column), and II (i–l; right column) to the sample CDF (a, e, i; top rows), the PDF (c, g, k), and the HF (d, h, l; bottom row). The subset panels in a, e, and i show blow-ups of the main panels, with the left subset from the bottom left and the right subset from the top right portion of sample and model CDFs. The best-fitting model functions are shown in gray (smooth curves) and data in black. The parameters of these functions are identified in the top panels. Sample PDFs and HFs were computed using a running average over 30 ISIs; thus, bin width varies with ISI. The center row (b, f, j) shows the residual probabilities between sample and model CDF (data minus fit). Data are for AN fiber 2001–06-12 with an SR of 65.1 spikes/s and are based on 2802 ISIs, as identified at the top of the figure. See Results for additional explanations.