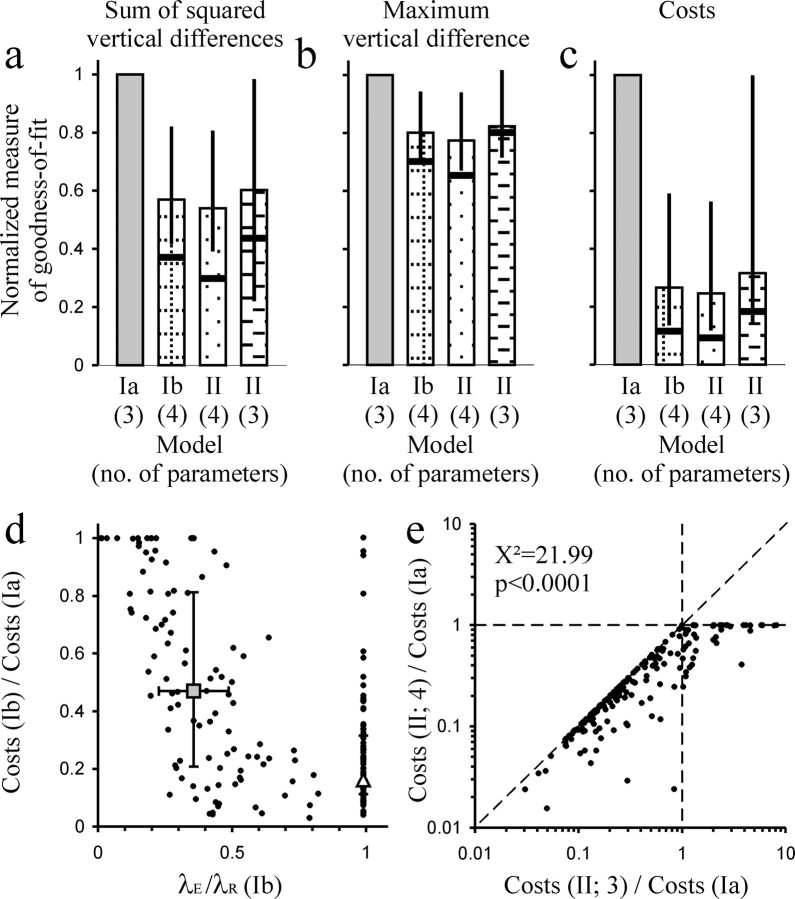
Figure 5.
Quantitative comparisons of the models. a–c, Histograms showing various measures of goodness-of-fit of the three different models as indicated below each column. The right column shows the measures for a simplified version of model II, which has only three parameters. a, The measure of goodness-of-fit is the sum of the squared vertical differences between a given sample CDF and the model CDF; in b, it is the maximum vertical difference; and in c, it is the cost function that was minimized during the fitting procedure. For each sample, the measures for models Ib and II have been normalized with respect to those for model Ia. The vertical bars represent the median and the vertical lines represent the interquartile range; the thick horizontal bars represent the medians of the measures obtained from the top 19 of the 186 samples when ranked according to number of ISIs. d, Plot of the costs of model Ib normalized to those of model Ia and plotted against the ratio of the estimates of λE and λR. The two larger symbols represent the medians, and the horizontal and vertical bars represent the interquartile ranges of the two subgroups of samples for which the estimates of λE and λR are nearly identical (triangle) or for which they differ substantially (square). e, Plot, along the abscissa, of the ratio of the costs of a simplified three-parameter version of model II to the costs of model Ia against, along the ordinate, the ratio of the costs of the full four-parameter version of model II to the costs of model Ia. The ratio between the three-parameter models is smaller than 1, indicating a better fit of the simplified model II, in 137 of 186 samples (data points left of vertical dashed line), a highly significant proportion (χ2 = 21.99; p < 0.0001). The addition of the fourth parameter to obtain the full version of model II brings about further, although relatively small, improvements (distance of data points from diagonal). See Results for additional explanations.

