
Figure 6.
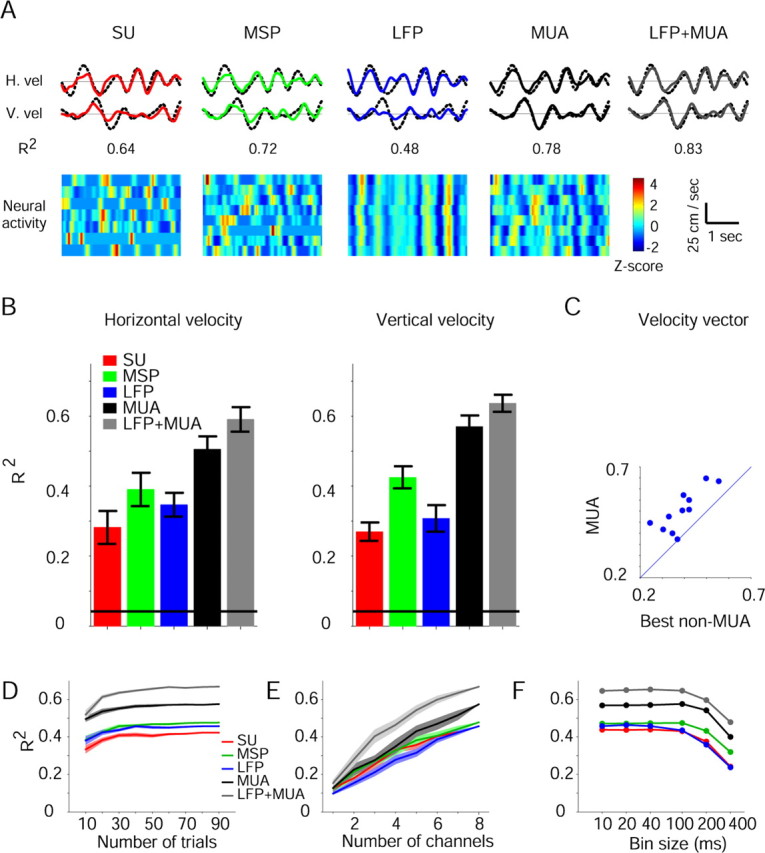
Multichannel predictions during tracing. A, Reconstructions of horizontal (top) and vertical (middle) hand velocities during a single tracing trial (colored lines). Dotted black lines show actual velocities and numbers below each trace measure reconstruction quality (R2). Reconstructions were based on the neural activity shown at the bottom (recorded from PMd during one trial and standardized for illustration purposes). B, Reconstruction quality, measured by the coefficient of determination (R2) between actual and predicted velocities, was averaged over 11 tracing sessions, separately for horizontal (left) and vertical (right) velocities. Horizontal lines, Chance R2 values (see Materials and Methods). Error bars indicate SEM. MUA was the best single predictor, although combined information from MUA and LFPs provided the most accurate predictions. C, The MUA-based R2 was plotted versus the highest non-MUA-based R2. Reconstructions based on MUA recordings were more accurate in all sessions. D–F, R2s between the actual and predicted velocity vector were estimated for a single tracing session in which neural activity was recorded by eight microelectrodes (and seven SUs) during the same 96 trials. In all cases, MUA recordings yielded more accurate predictions than the other signals, while combined LFP and MUA predictions were the most accurate. D, Number-of-trials dependency. Conventions are the same as in Figure 5A. E, Number-of-channels dependency. F, Bin-size dependency. For each tracing trial, neural activity in a 400 ms window immediately before movement was divided into 1–40 bins (10–400 ms long) and the R2 of each signal type estimated.