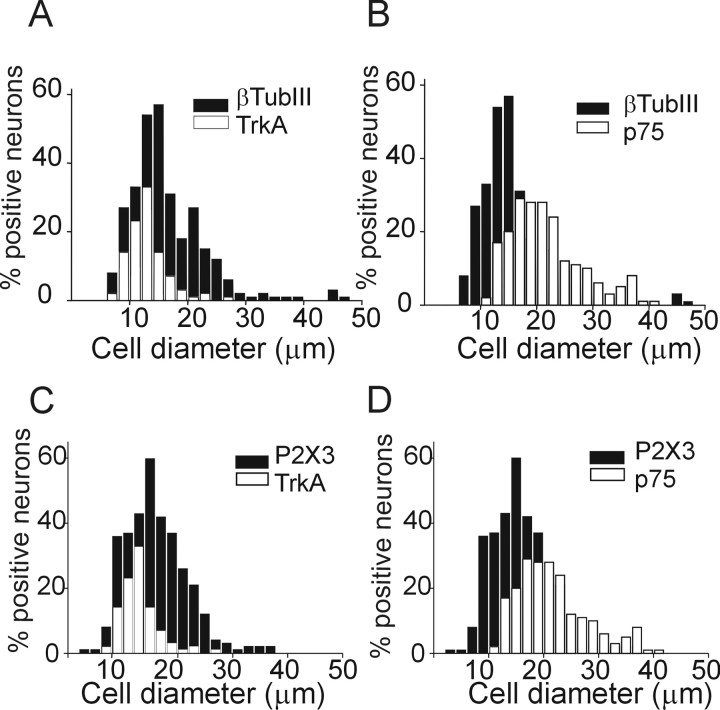
Figure 3.
Somatic size distribution of TG neurons immunoreactive for TrkA, p75, and P2X3 receptors. A, B, Distributions of neurons immunostained with anti-TrkA or anti-p75 receptor antibodies (open columns) over the total neuronal population stained with anti-β-tubulin III (βTubIII) antibody (taken as 100%; filled columns; n = 8 or 7 experiments, respectively). C, D, Distribution of neurons immunostained with anti-TrkA and p75 (open columns) receptor antibodies over the total P2X3-positive population (taken as 100%; filled columns; n = 6 experiments).

