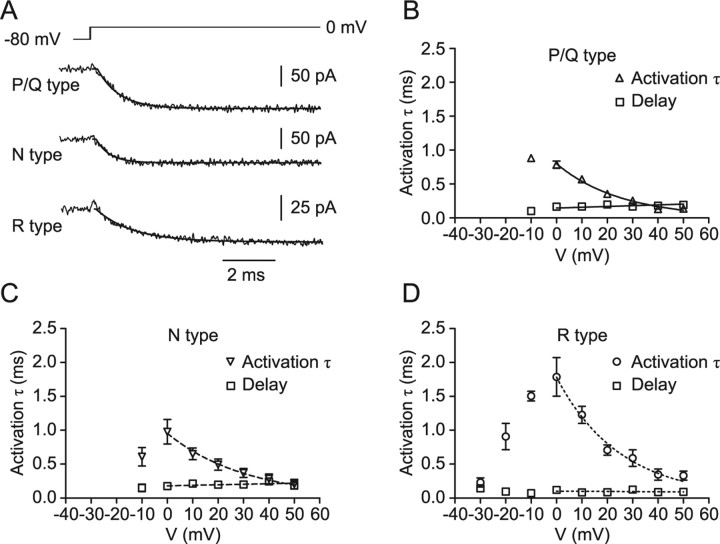
Figure 4.
Activation kinetics of presynaptic P/Q-, N-, and R-type Ca2+ channels. A, Traces of P/Q- (top trace), N- (center trace), and R- (bottom trace) type components of the presynaptic Ca2+ current obtained by pharmacological isolation and digital subtraction. Pulse protocol: holding potential −80 mV, test pulse to 0 mV. Traces were fitted with Equation 1 (continuous lines). B–D, Activation time constant (inverted triangles, triangles, and circles) and delay (squares) for P/Q- (B), N- (C), and R- (D) type components. Time constant values for voltages ≥0 mV were fitted with exponential functions, and delay values were fitted by linear regression. Data are from five, five, and seven boutons.

