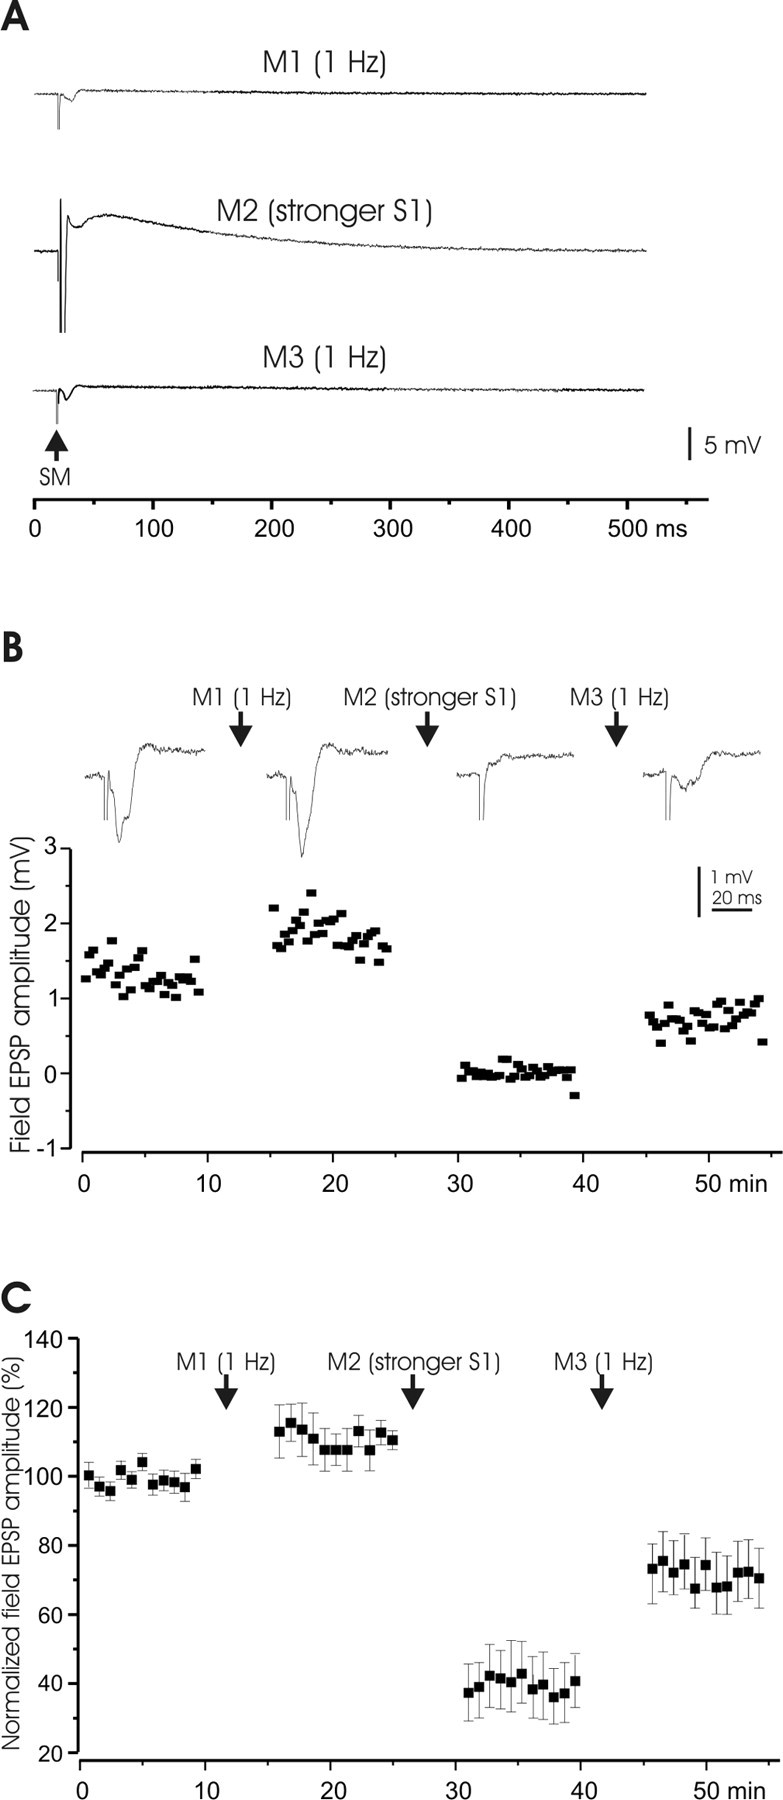
Figure 2.

Plasticity of field potential responses to parallel fiber activation. A, Manipulation protocols. All test stimuli were applied at 0.1 Hz. Test stimuli were usually maintained for 8–10 min, except in a few cases as pointed out elsewhere. All manipulations were done at 1 Hz for 5 min. M1, Increase in frequency to 1 Hz; M2, stronger stimulation pulses (stimulus duration increased from 0.1 to 0.5 ms) and delivery at the higher frequency of 1 Hz; M3, same as M1. B, A representative example of the effect of higher frequency stimulation and stronger stimulation on field potential responses to PF stimuli. Stimulus electrodes were placed in the molecular layer (S1) to activate PFs. The top panel shows average responses to S1, and the bottom panel shows a time graph of potential amplitudes. Manipulations (M1–M3) protocols are illustrated in A. C, Pooled data of field potential responses (n = 5; mean ± SEM; same below) to the manipulations (M1–M3) as shown in A. Note that the field responses before any manipulations were used as control (100%) and to normalize the responses after different manipulations. M2 and M3 were repeated in some cells, and the responses after the last repetition were pooled.
