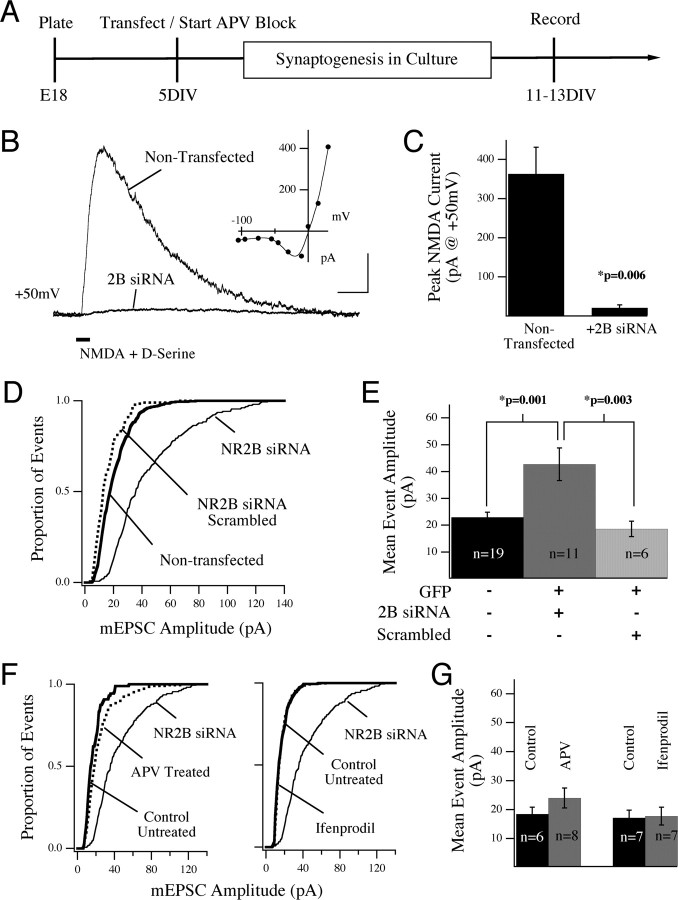
Figure 6.
Suppression of NR2B protein in individual cortical neurons leads to enrichment of synaptic AMPARs. A, Experimental design: rat cortical neurons were cultured from E18 embryos and transfected at 5 or 6 DIV with siRNA against NR2B (and GFP as a transfection marker) or treated with NMDAR antagonists starting at 5 DIV. Recordings were made 7 d later at 12 or 13 DIV. B, Efficacy of the NR2B-siRNA construct was shown by stimulating neurons with local, somatic application of NMDA plus d-serine in the presence of TTX, gabazine, and d-serine. Example traces show average responses from a siRNA-expressing and nontransfected control neuron. These traces are averages of five trials taken from two neurons within a single field of view in culture, and therefore stimulated under identical conditions. The I–V relationship for the NMDAR-evoked current in the nontransfected neuron is shown (inset). Calibration: 200 pA, 200 ms. C, The NMDA-evoked response recorded at +50 mV was significantly suppressed in neurons expressing siRNA against NR2B compared with nontransfected neurons in the same cultures (mean ± SEM). D, The cumulative distribution of mEPSC events recorded under each experimental condition are shown compared with the nontransfected event population (thick line). Transfection of neurons with siRNA against NR2B led to an increase in mEPSC amplitude (solid line) compared with nontransfected control cells in the same dish (thick line). Neither GFP alone nor scrambled siRNA (two conditions combined, dotted line) mimicked the effect of NR2B siRNA. This effect was confirmed by analysis of the mean event amplitude in cells expressing the siRNA (E). The transfection conditions for this experiment are shown in E. F, Cultures were treated from 5 DIV with either 100 μm APV or 3 μm ifenprodil (dotted lines). AMPA-mediated mEPSCs were recorded between 11 and 13 DIV. Neither the cumulative histograms (F) nor comparison of cell means (G) revealed a difference in mEPSC amplitude after chronic antagonist block. In F, the siRNA event population distribution is shown for comparison.

