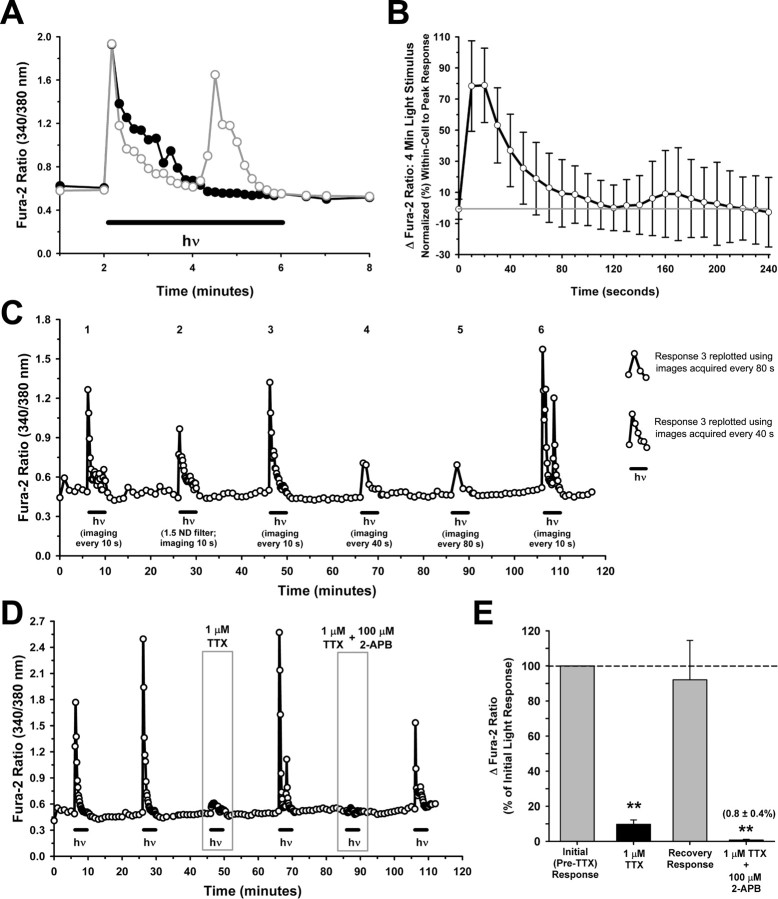
Figure 6.
Ca2+ responses of ipRGCs exposed to light for 4 min. A, Recordings from two adjacent ipRGCs, exposed to the same light stimulus, exhibiting two distinct response patterns. For all traces (except second response in [C]) hν indicates broad-spectrum light, 6.9 × 10¹³ photons/s/cm2 at 480 nm. B, Data summary (mean ± 1 SD; n = 26) illustrating the average decay in Ca2+ responses during 4 min light stimuli. The light was turned on after the first image (0 s) and subsequent images were acquired every 10 s. The baseline-subtracted response (Δfura-2 ratio) at all time points was normalized to the each cell's peak response. C, Recording from an ipRGC exposed 6 times to 4 min light stimuli. During responses 1, 2, 3, and 6, fura-2 images were acquired every 10 s. For response 2, the standard stimulus intensity was reduced with a −1.5 log neutral density filter. During responses 4 and 5, fura-2 images were acquired every 40 and 80 s, respectively. The traces at far right represent response 3 replotted using the fura-2 ratios obtained every 40 or 80 s rather than 10 s. D, E, Example trace (D) and data summary (means ± SEM, normalized to pretreatment responses) showing effect of TTX alone and in combination with 2-APB on Ca2+ responses to the 4 min light stimuli (E). TTX was tested in 8 ipRGCs, with 2-APB plus TTX subsequently tested in five of the eight cells. **p < 0.01, one-way repeated-measures ANOVA, Tukey's test, compared with initial responses.

