
Figure 6.
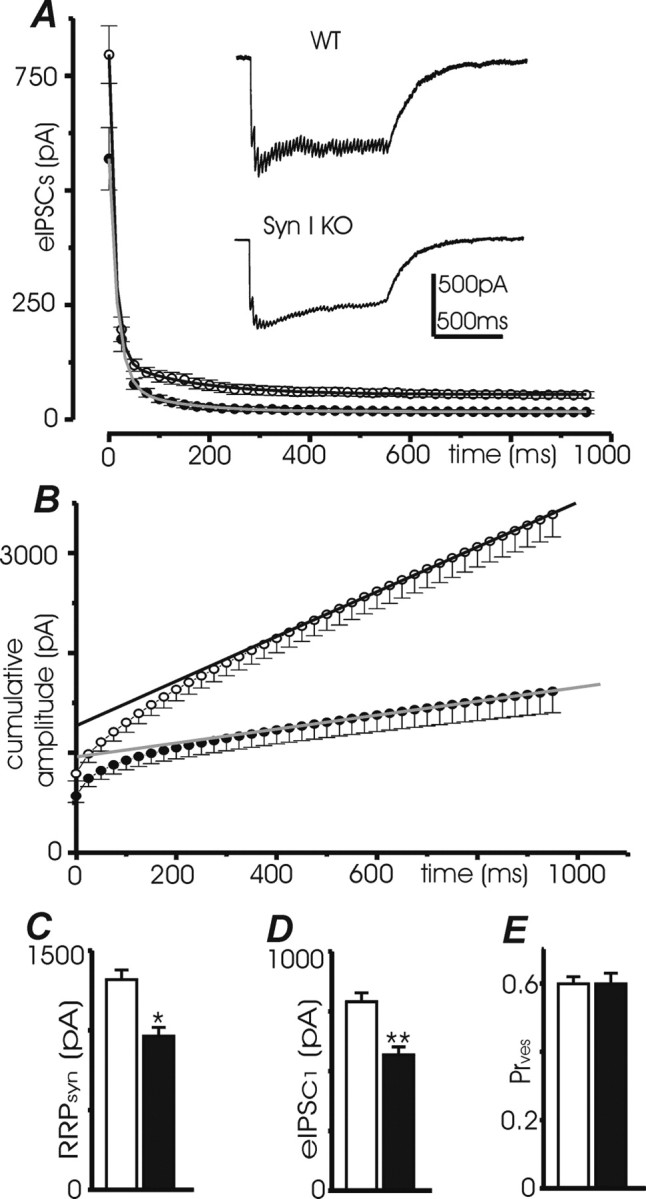
Estimate of RRP and Pr by using the cumulative amplitude profile analysis. A, Plot of mean eIPSCs amplitude (±SE) versus time during repetitive stimulations at 40 Hz of WT and SynI KO neurons (21–28 DIV; n = 25 for both genotypes) fitted with the biexponential function: I(t) = yo + Af e (−t/τf) + As e (−t/τs) (WT, black trace; KO, gray trace). Representative recordings during a train of 40 stimuli at 40 Hz in single WT and SynI KO neurons are shown in the inset. Extracellular stimulation artifacts were removed. B, Cumulative eIPSC amplitude profile. To estimate the RRP, data points in the range of 0.4–0.9 s were fitted by linear regression and back-extrapolated to time 0 (WT, black trace; KO, gray trace) to estimate the cumulative eIPSC amplitude before steady-state depression (RRPsyn). C–E, The size of RRPsyn (C), the amplitude of the first eIPSC in the train (D), and the calculated Pr ves (E) are shown as means ± SE (WT, white bars; KO, black bars). **p < 0.01 versus WT, two-tailed Student's t test. n = 25 for both WT and SynI KO.