
Figure 6.
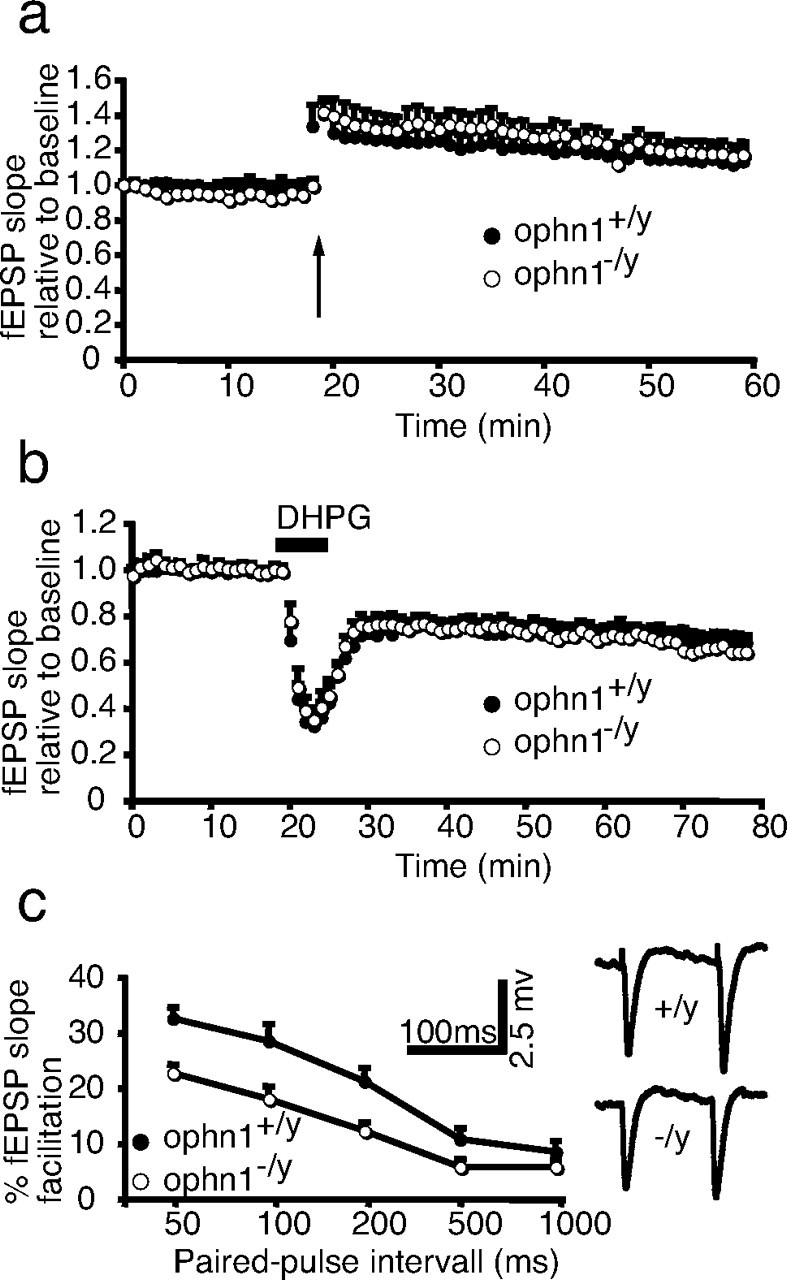
Altered short-term and normal long-term synaptic plasticity in CA1 of ophn1−/y hippocampus. a, b, Normal LTP and DHPG-induced LTD in ophn1−/y mice. The slope of the fEPSP was normalized regarding its mean value calculated before the tetanic stimulus (a, arrow) or before application of DHPG (b, horizontal bar) and expressed as a function of time. c, Reduced PPF in ophn1−/y mice. fEPSP were evoked using paired-pulse stimulation. The y-axis represents the slope of the second fEPSP expressed as the percentage of the slope of the first fEPSP. The x-axis represents the interpulse interval. For each panel, values are the mean ± SEM of the indicated number of experiments.