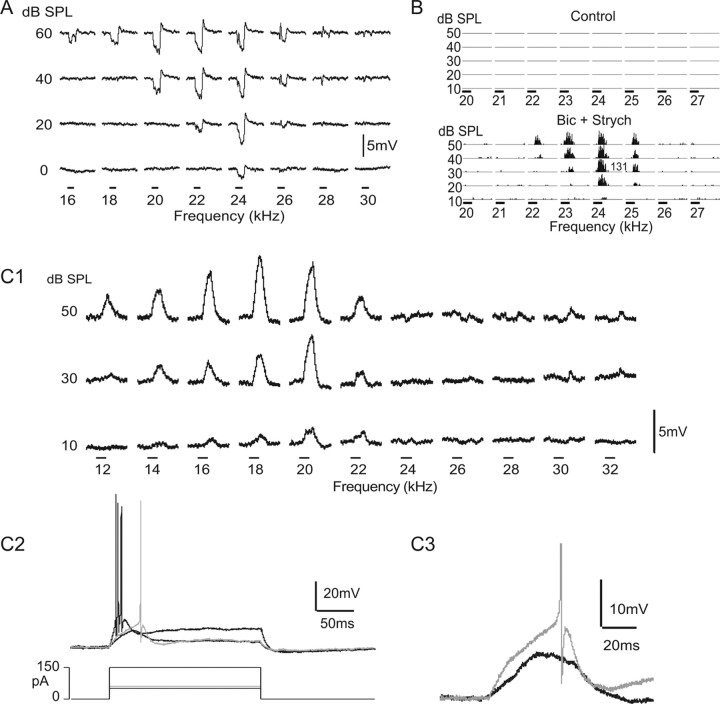
Figure 2.
Tuning curves of two null-tuned cells recorded with patch electrodes (A, C1) and from another null-tuned cell recorded with an extracellular electrode (B). A, Null tuning curve from a cell whose responses were dominated by inhibition. Traces are averages of five trials. Time bars, 50 ms. Resting potential was −46 mV. B, Null tuning curves recorded with an extracellular electrode. When inhibition was blocked by bicuculline (Bic) and strychnine (Strych), the underlying suprathreshold excitation that was completely suppressed by inhibition was released and allowed the cell to express a V-shaped tuning curve. Time bars, 15 ms. C1, Another null-tuned neuron recorded with a patch electrode whose responses were dominated by subthreshold excitation. Time bars, 50 ms. C2, Responses of the same cell in C1 evoked by injections of depolarizing current steps. Current injections of +60 pA evoked a single action potential (gray trace), and higher current steps (+150 pA) evoked multiple action potentials. Lower currents were subthreshold. C3, Enlarged trace showing the threshold response evoked by +60 pA current injection (gray trace) and the subthreshold depolarization evoked by 18 kHz tone at 50 dB SPL (black trace), the largest tone-evoked response recorded. Resting potential was −55 mV.

