Figure 7.
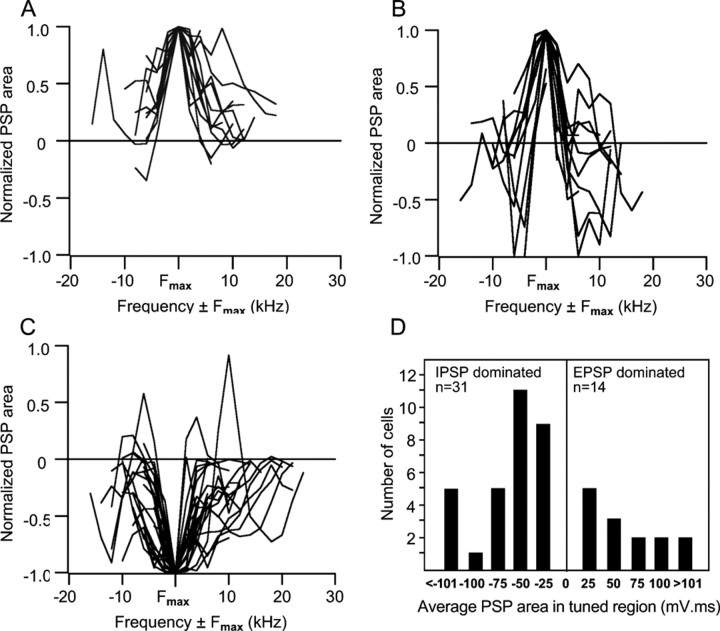
Integrated PSP values for cells dominated by excitation, inhibition, and excitation with inhibitory sidebands. In theses graphs, the normalized PSP responses are aligned to the largest (absolute value) PSP area (Fmax) and graphed as responses evoked by frequencies above and below the frequency that evoked Fmax. A, Normalized PSP values in the tuned regions of 14 EPSP-dominated cells. Integrated PSP values are positive (depolarized) for responses evoked by almost every frequency in all cells. B, Normalized PSP values in the tuned regions of 17 cells that had excitatory regions flanked by inhibitory surrounds. The responses to Fmax were excitatory in all of these cell, but frequencies above and or below Fmax evoked strong inhibitions. C, Normalized PSP values in the tuned regions of 31 IPSP-dominated cells. Three cells have a prominent excitatory peak, appearing to be similar to the excitatory-dominated cells with sideband inhibition in B. The reason for the excitatory peaks is that a larger and longer-lasting excitation than inhibition was evoked by one or two frequencies in their tuned regions, whereas the responses evoked by all other frequencies were inhibitory. D, Average PSP areas in the tuned regions of cells dominated by IPSPs and cells dominated by EPSPs. The average PSP area in every IPSP-dominated cell was negative (hyperpolarized), whereas the average PSP area in every EPSP-dominated cell was positive (depolarized). Differences in the absolute values among EPSP-dominated or among IPSP-dominated cells were attributable to differences in PSP amplitudes and durations. Some of the differences were a consequence of the durations of the tone bursts, which were not the same in all cells and ranged from 10 to 50 ms among cells.

