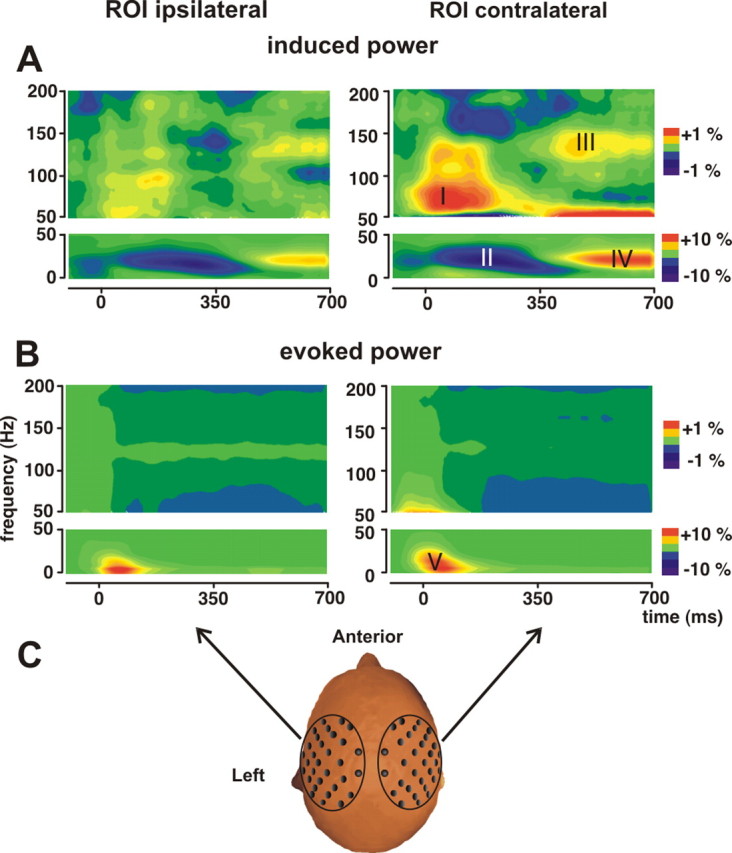
Figure 2.

Pain stimulation yields induced and evoked oscillatory responses. A, Grand mean time-frequency representation of induced oscillatory responses with high-intensity stimuli regardless of the task, averaged across 31 sensors for each side and 20 subjects. Responses are plotted as percentage signal change relative to the prestimulus baseline (−200 to 0 ms). In four distinct time-frequency regions (labeled I–IV), induced power changes can be observed. B, Calculation of evoked responses revealed only one significant peak (labeled V). C, Each dewar, which contains 31 sensors, builds one region of interest (ROI). In all subjects, stimuli were applied to the left hand.
