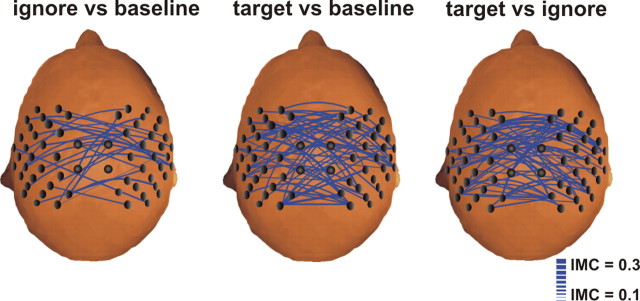
Figure 5.
Attention-dependent modulation of the IMC across hemispheres (below). Only interhemispheric combinations are displayed, and the thickness of the lines reflects the strength of the IMC. An increase in synchronization was observed for activation pattern III (120–140 Hz, 400–600 ms) for all subjects (n = 20). In the left panel, a significant increase in IMC was calculated between pattern III and the corresponding baseline before stimulus onset for the nontarget condition. In the middle panel, the same is shown for the target condition. Direct comparisons between target and nontarget conditions were calculated in the right panel.

