
Figure 2.
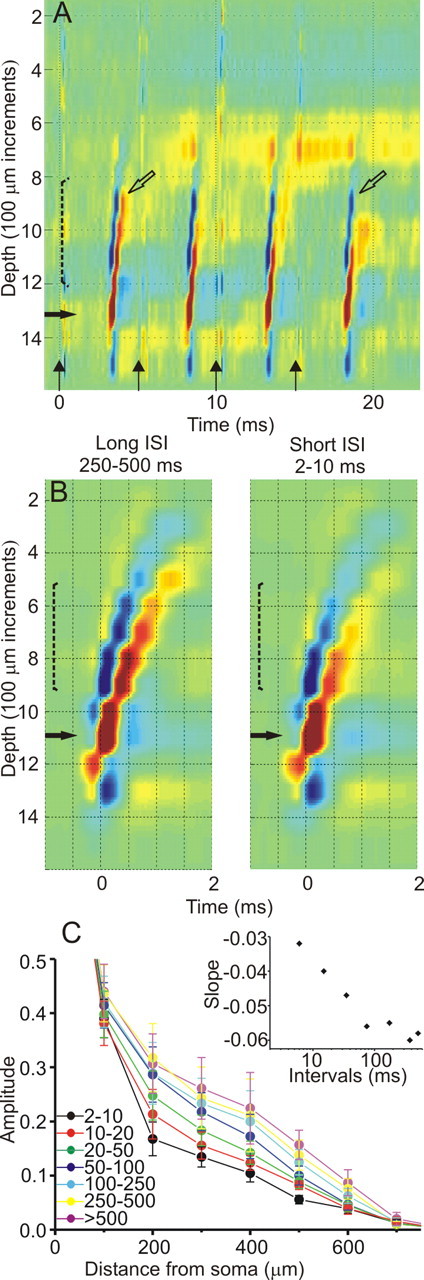
The effect of firing frequency on the BPAP. A, Reduction in BPAPs during high-frequency (200 Hz) antidromic activation. Four stimuli are delivered to the superior colliculus (vertical arrows). Open arrows mark the same depth for BPAPs resulting from the first and fourth antidromic spikes in the train for comparison. B, Examples of spike-triggered averaged CSD selected by the interval from the preceding spike (marked above), revealing faster decay for the shorter intervals. C, Summary diagram of the BPAP decays with distance from the soma for different preceding intervals, measured from the spike-triggered averaged CSD and normalized to the somatic spike. Data from 10 neurons are expressed as mean ± SEM. The inset displays the relationship between the slopes of the linear fits to the decay curves and the mid-bin ISI, revealing strong correlation for frequencies higher than 10 Hz.