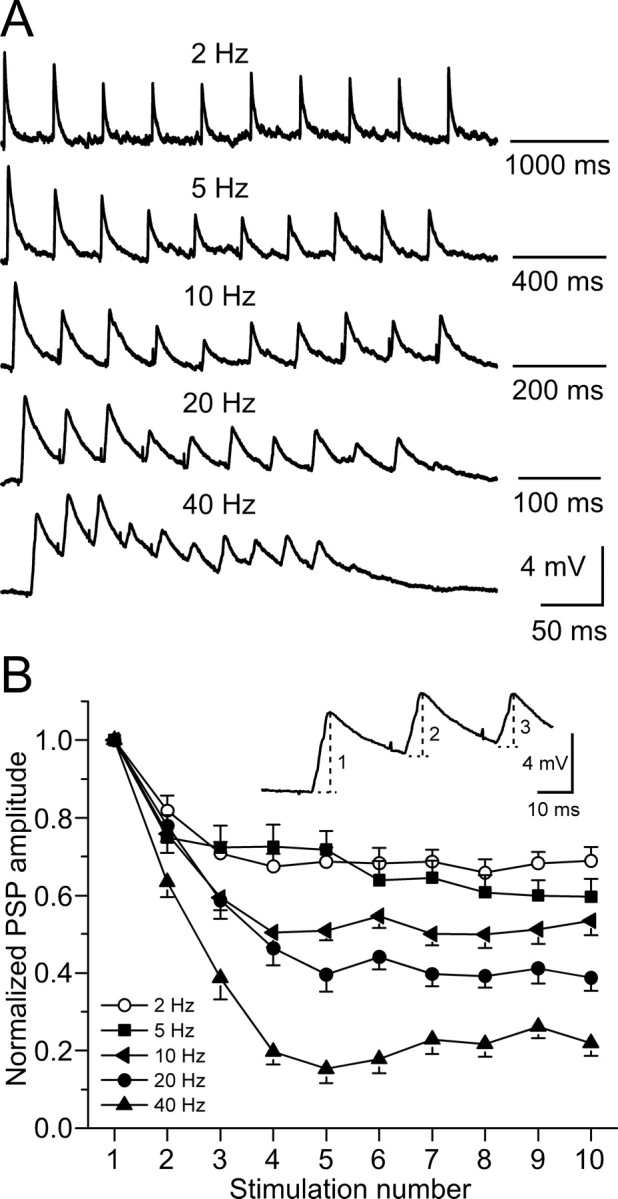
Figure 1.

Short-term depression of MGv-evoked PSPs in controls. A, PSPs of a control neuron to train stimulation of MGv with 10 current pulses at 2–40 Hz. Stimulation intensity was adjusted to obtain ≈5 mV response on the first pulse. Each trace is an average of three trials. Resting membrane potential is −65 mV. B, PSP amplitude as a function of stimulus number in the train. PSP amplitude was measured from baseline just before each response onset to the peak amplitude of the response (dashed lines in example) and was normalized to the first response in each train. Data points were averaged from 21 control neurons.
