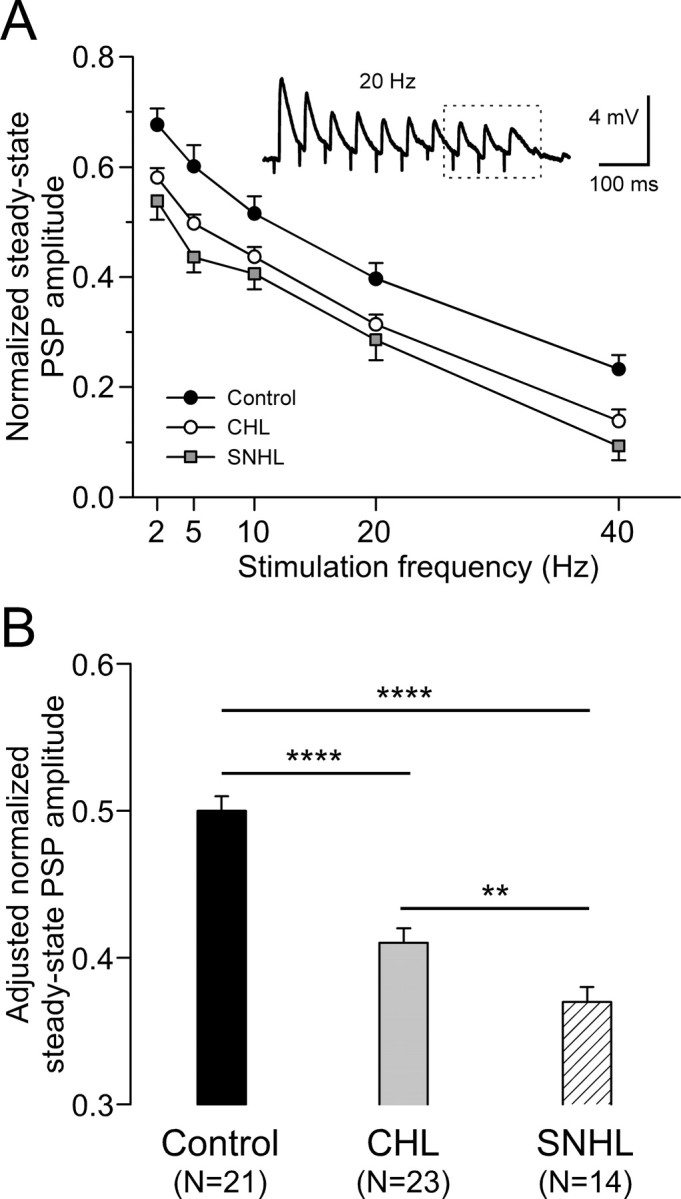
Figure 3.

Hearing loss decreases steady-state PSP amplitude. A, Normalized steady-state PSP amplitude plotted against stimulation frequency for CHL (open circles; n = 23) and SNHL (filled squares; n = 14) neurons compared with control neurons (filled circles; n = 21). PSP amplitudes were normalized to the first one for each train and the last three responses were averaged to estimate the normalized steady-state PSP amplitudes (dashed box of inset). B, Statistical comparison of adjusted steady-state PSP amplitudes among control, CHL, and SNHL neurons. ANCOVA with stimulation frequency as a covariate, **p < 0.01; ****p < 0.0001.
