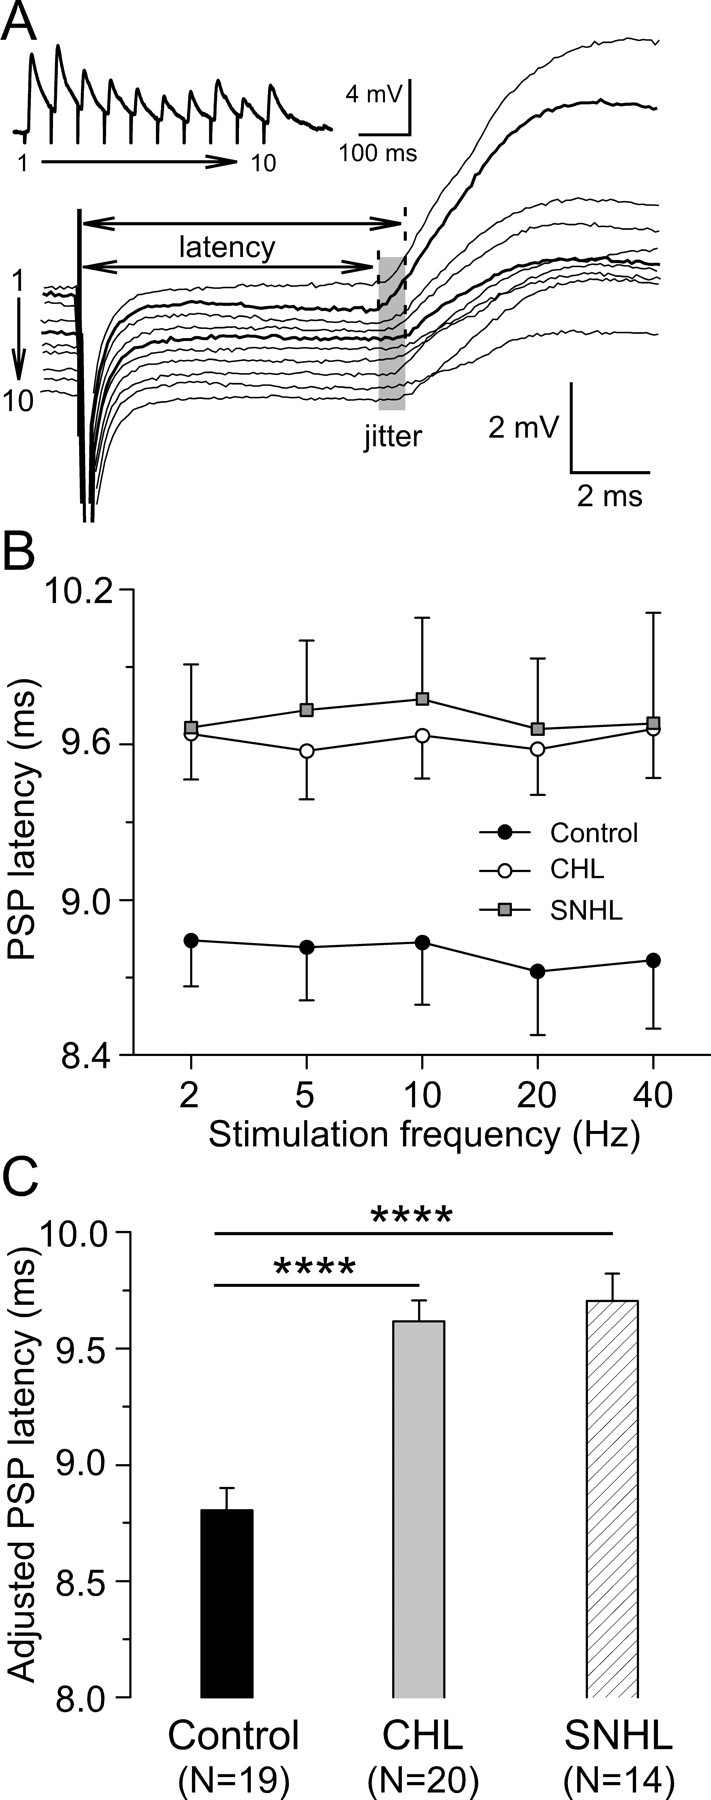
Figure 4.

Hearing loss increases synaptic latency. A, PSP latencies of a control neuron in response to 20 Hz train stimulation. The individual PSP was aligned to the stimulus onset to show synaptic temporal jitter during the train (shaded area). PSP latencies were measured from stimulus onset to the rising point of synaptic responses (dashed lines). The derived trace was shown at the top left corner. The resting membrane potential is −64 mV. B, PSP latency plotted against stimulation frequency for CHL (open circles; n = 20) and SNHL (filled squares; n = 14) neurons compared with control neurons (filled circles; n = 19). C, Statistic comparison of adjusted PSP latency among control, CHL, and SNHL neurons. ANCOVA with stimulation frequency as a covariate, *p < 0.05; ****p < 0.0001.
