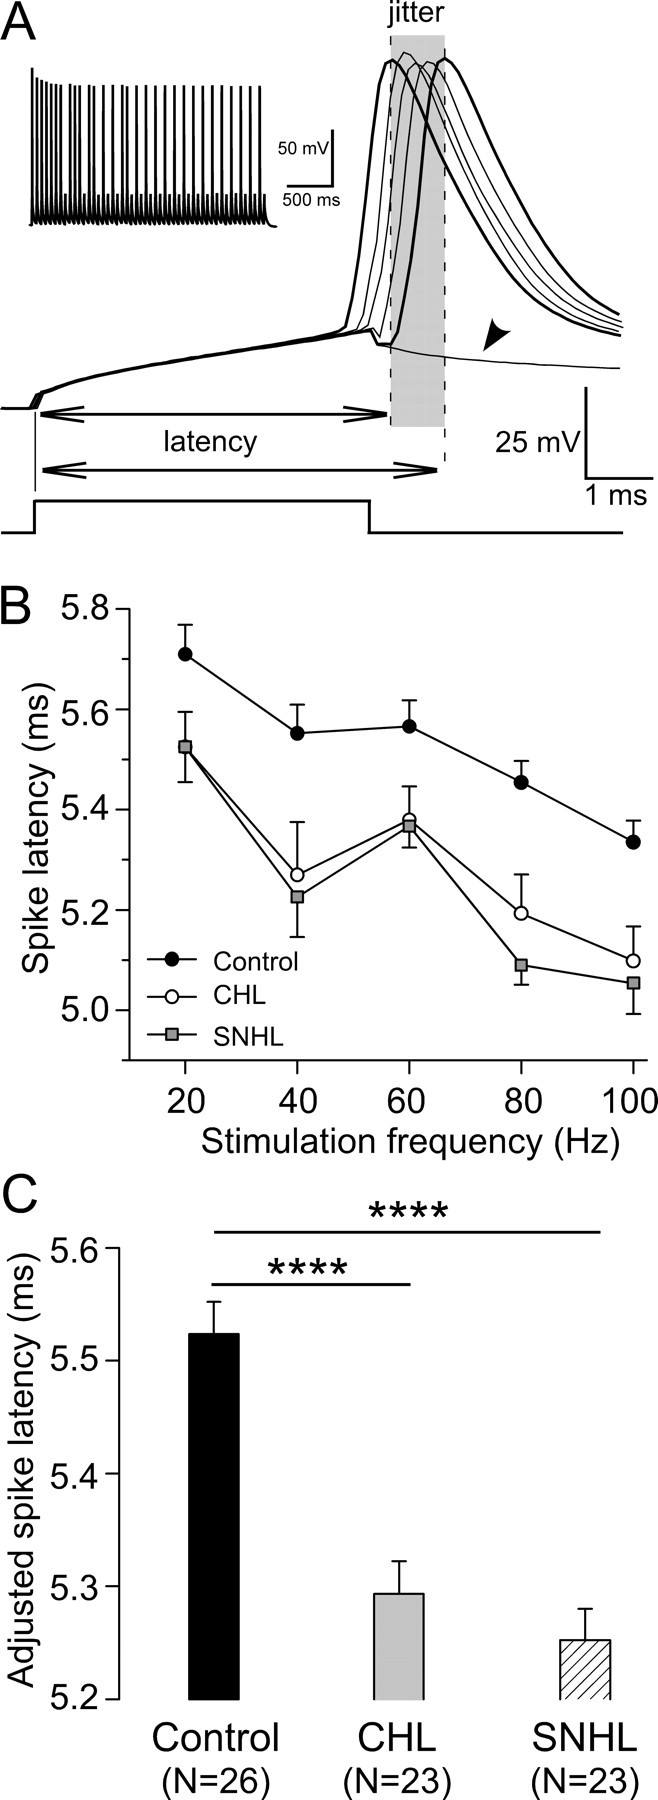
Figure 7.

Hearing loss reduces spike latency. A, Spike temporal pattern of a control neuron in response to 20 Hz train pulses. Several voltage responses were aligned to the stimulus onset to show spike temporal jitter during the train (shadowed area). The spike latency was measured from the stimulus onset to the peak of its resultant action potential (dashed lines). Note voltage deflection that failed to evoke an action potential (arrowhead). The derived trace is shown at the top left corner. Resting membrane potential is −64 mV. B, Spike latency plotted against stimulation frequency for CHL (open circles; n = 23) and SNHL (filled squares; n = 23) neurons compared with control neurons (filled circles; n = 26). C, Statistical comparison of adjusted spike latency among control, CHL, and SNHL neurons. ANCOVA with stimulation frequency as a covariate, ****p < 0.0001.
