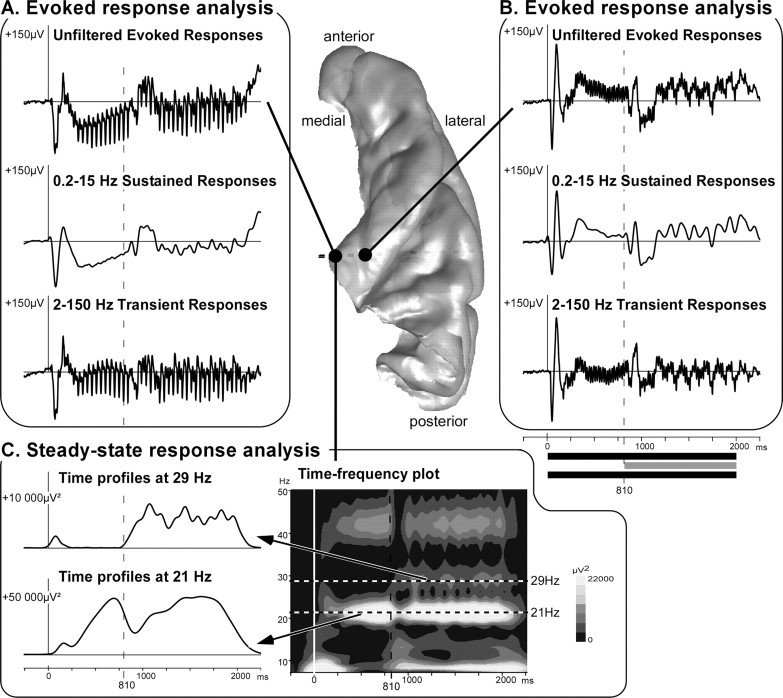
Figure 3.
Illustration of the typical electrophysiological responses and their location in the 3D rendering of the temporal cortex of patient 10. A, B, The evoked response analysis consists of averaging single trials from EEG filtered with different bandwidth to dissociate transient and sustained responses. Top curves, Unfiltered evoked responses; middle curves, sustained responses obtained from 0.2–15 Hz filtered EEG; bottom curves, transient responses obtained from 2 to 150 Hz filtered EEG. The periodic steady-state activity is visible on the unfiltered and transient responses in A. C, The SSR analysis is based on a time-frequency transformation of electrophysiological activities (time-frequency power averaged after a wavelet-based transform of each single trial). Twenty-one, 29, and even 42 Hz steady-state evoked activities are clearly visible on the time-frequency plots. The time profiles of SSR power could then be constructed at 21 and 29 Hz from the time-frequency plots. All of these responses are baseline corrected with respect to a prestimulus period preceding the stimulus onset.

