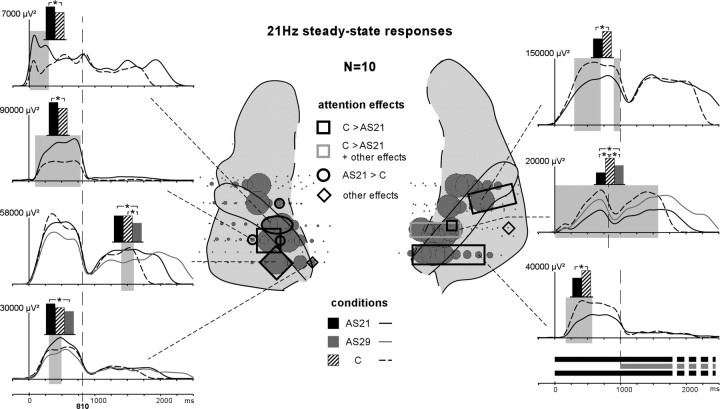
Figure 7.
Emergence and attention effects of the evoked 21 Hz SSR during parts 1 and 2. The distribution of the 21 Hz SSR is indicated by gray disks on the anatomical plots. The diameter of these disks correspond to the normalized (across contacts of each electrode passing through the superior temporal cortex in each patient) mean amplitude of the SSR between 450 and 750 ms (stim-part1). Black squares on the schema correspond to contacts where only the C > AS21 effect was found and gray squares correspond to contacts where at least the C > AS21 effect was found. Black ovals correspond to contacts where only the AS21 > C effect was found. Diamonds correspond to contacts where any other effect (not the AS21 > C or C > AS21 effects) was found. The time courses of these effects are depicted on the left and right sides of the figure (significant differences are indicated by gray shaded areas). The curves are obtained by computing the time profile at 21 Hz from the wavelet-based time-frequency decomposition. The black, gray, and hatched boxes indicate which conditions are compared.

