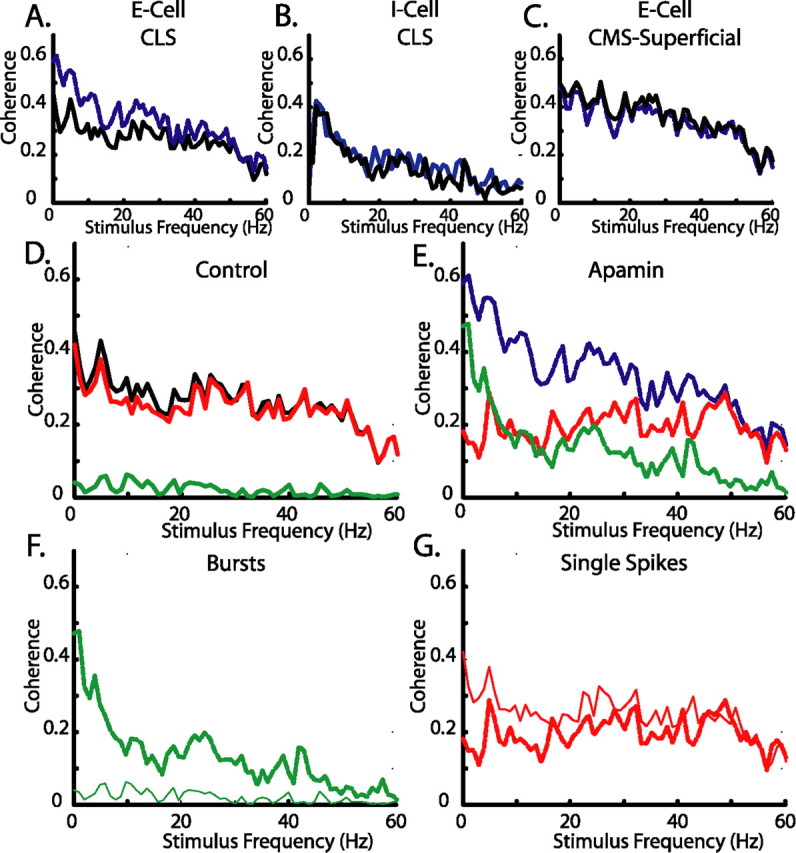
Figure 6.

Increased response to low-frequency stimuli follow SK channel block. Neurons were given a RAM current injection of 0–60 Hz Gaussian noise representative of naturalistic stimuli. A, Coherence plot of a representative broadband CLS cell showing an increased response to low frequencies after apamin (blue). B, C, Neither I-cells (B) nor CMS superficial cells (C) show frequency–response changes to the RAM after application of apamin (1 μm; blue). D, E, Separation of the coherence response of the CLS cell from A under control conditions (D; black;) and apamin (E; blue) into components attributable to single spikes (red) or bursts (green). F, Overlay of burst component from D (thin trace) and E (thick trace) showing an increased burst response to low frequencies. G, Overlay of the isolated spike component from D (thin trace) and E (thick trace) showing only minor response changes.
