Figure 8.
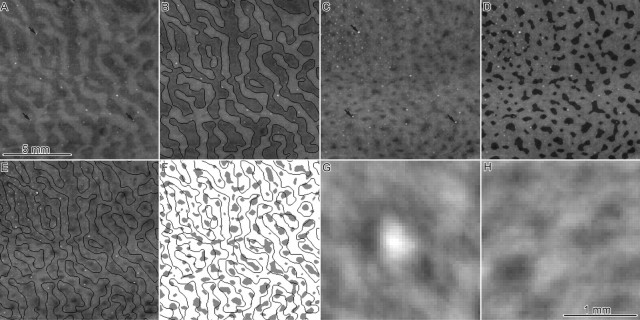
Alignment of CO patches and columns in the human. A, Montage of ocular dominance columns in layer 4C from the green-shaded zone in Figure 7. B, Borders of ocular dominance columns in A, defined by the Canny edge detector algorithm, drawn one pixel wide. C, CO patches in layer 3 from the same region. Arrows show examples of blood vessels used to align A and C. D, Thresholded patches, superimposed on the image in C. E, Column borders in B transferred onto the image in C, showing the alignment between patches and ocular dominance columns. F, Thresholded patches in D with ocular dominance column borders. G, Spatial cross-correlation of patches and column borders. The plot shows the mean density of pixels comprising column borders plotted with respect to every patch pixel (as defined in D), with each patch pixel centered in the image. The white center of the spatial average indicates that column borders rarely pass through patches. H, Spatial average as in G, generated after rotating the column border image 90°. The rotation eliminates the structure seen in G by randomizing the relationship between column borders and patches (see Materials and Methods). Scale bars: A–F, 5 mm; G, H, 1 mm.

