Figure 4.
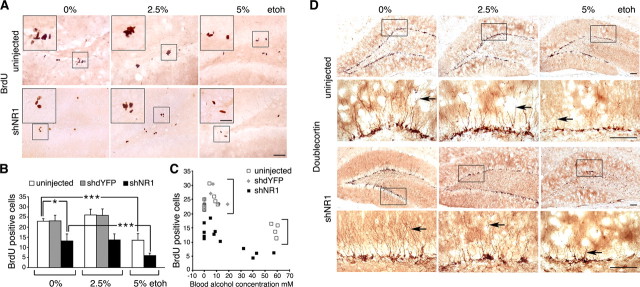
High- but not low-dose ethanol impairs neurogenesis in the dentate gyrus. A, Representative images of BrdU immunohistochemistry on hippocampal sections from control and shNR1-injected rats on 0, 2.5, and 5% EtOH. Larger insets contain higher-magnification views of areas boxed in their respective panels. Scale bars: 200 μm; insets, 25 μm. B, Numbers of BrdU-positive cells per subgranular zone of dentate gyrus shown in relation to the EtOH diet. Data are represented as mean ± SEM; n = 4 per group. *p < 0.05, ***p < 0.001, calculated by two-way ANOVA with EtOH diet and treatment factors. There was no difference in the EtOH effect in the uninjected and shNR1 rats, strong evidence for the effect of both treatment and diet, and no difference between uninjected and shdYFP controls. C, Scatter plot of BrdU cell counts for uninjected and shdYFP- and shNR1-injected rats plotted against their blood alcohol concentrations. Brackets point to higher counts in NR1-intact compared with shNR1 rats (analyzed as above). D, Representative images of doublecortin immunohistochemistry performed on sections from control and shNR1-injected rats on 0, 2.5, and 5% EtOH. Boxes mark regions that are shown magnified below. Arrows indicate representative extent of dendritic arborization seen in each group. Scale bars, 100 μm.

