
Figure 6.
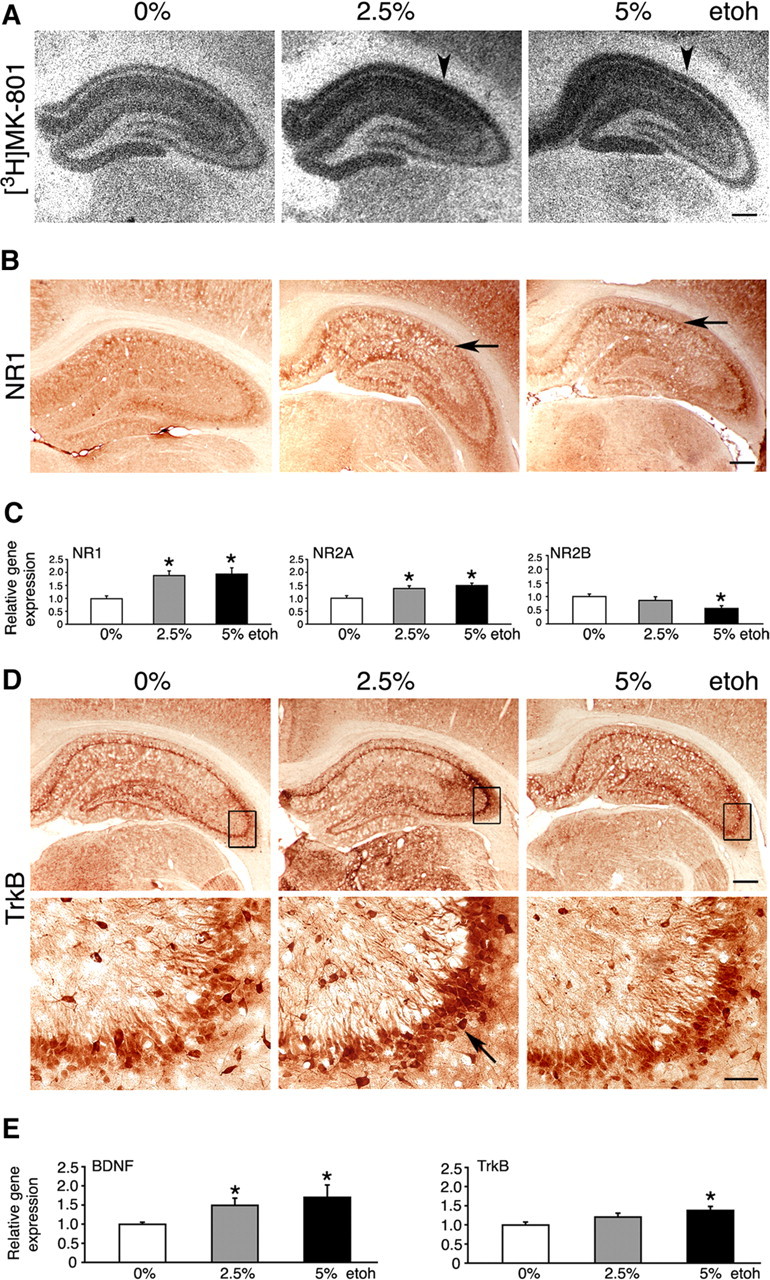
Molecular effects of ethanol feeding. A, B, EtOH intake increased expression of NMDARs in the hippocampus, revealed by increased [3H]MK-801 binding (arrowheads) and increased NR1 subunit expression (arrows). Representative images are shown. Scale bars, 500 μm. C, Levels of NR1, NR2A, and NR2B transcripts in uninjected rats on 0, 2.5, and 5% EtOH, determined by real-time RT-PCR. The results are the mean ± SEM of three independent experiments. *p < 0.05 versus 0% EtOH (one-way ANOVA). D, Representative immunohistochemistry images suggesting highest TrkB expression in the 2.5% EtOH brains (arrow). Boxes mark regions that are shown magnified below. Scale bars: top, 500 μm; bottom, 50 μm. E, Levels of BDNF and TrkB transcripts in uninjected rats on 0, 2.5, and 5% EtOH, determined by real-time RT-PCR. The results are the mean ± SEM of three independent experiments. *p < 0.05 versus 0% EtOH (one-way ANOVA).