
Figure 7.
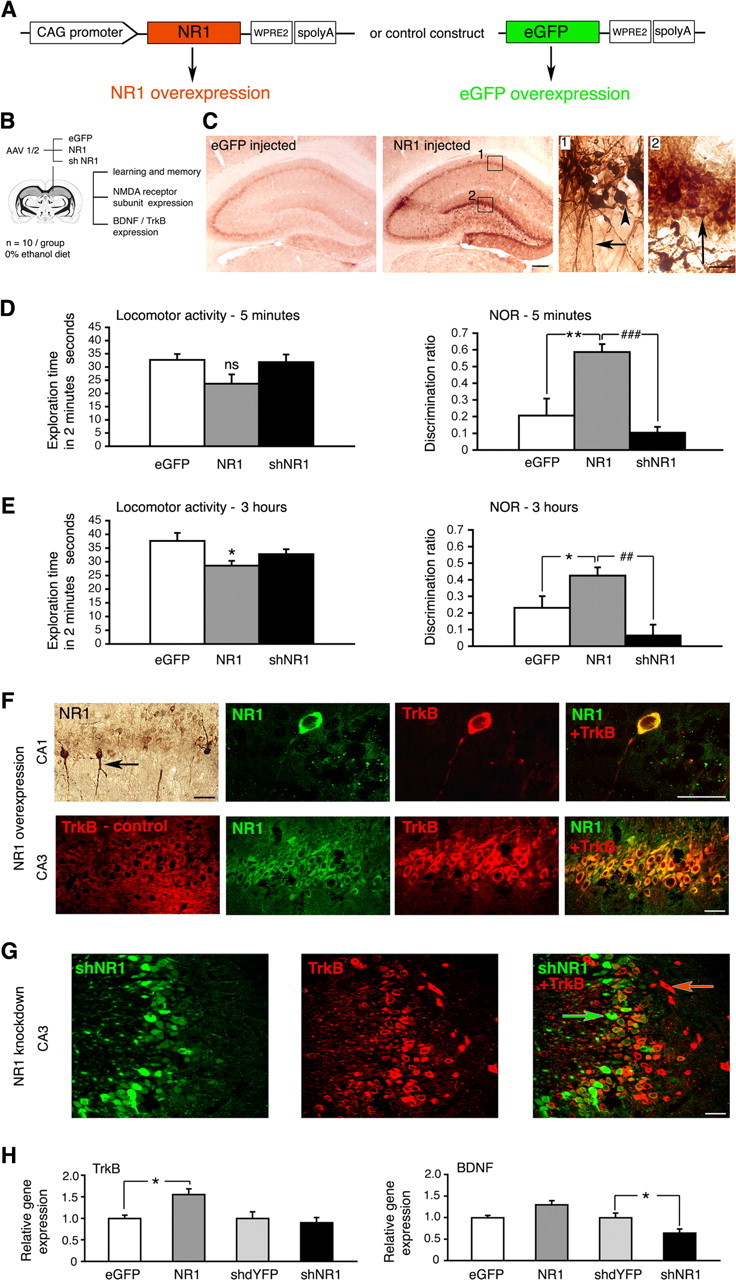
Consequences of NR1 overexpression in the hippocampus. A, Constructs driving overexpression of NR1 and eGFP control, respectively. WPRE2, Shortened WPRE sequence, modified to enable efficient packaging of large NR1 gene into AAV vector. B, Study design, including objectives. C, Representative immunohistochemistry images demonstrating NR1 overexpression in the hippocampus 6 weeks after injecting NR1-carrying vector. Panels 1 and 2 represent higher-magnification views of their corresponding boxes. Bodies of pyramidal cells (arrowhead) and their axonal projections (arrow) are shown in panel 1, and granule cells are shown (arrow) in panel 2. Scale bars: left, 500 μm; right, 25 μm. D, E, Novel object recognition (NOR) results at 5 min and 3 h, respectively. Locomotor activity is expressed as total exploration time accumulated during the first 2 min of testing in the choice phase. Effect of NR1 injection on the locomotor activity was not significant at 5 min (p = 0.068) but was significant at 3 h (p = 0.014). Discrimination ratios were calculated for the first 30 s of exploration time both at 5 min and 3 h to minimize the influence of the varied locomotor activity. Data are represented as the mean ± SEM. *p < 0.05; **p < 0.01; ##p < 0.01; ###p < 0.001. ns, Nonsignificant (one-way ANOVA). F, Representative confocal images of TrkB (red) and NR1 (green) expression within CA1 and CA3 regions of the hippocampus, examined 6 weeks after injecting NR1-carrying vector. The exception is the top leftmost panel containing a corresponding immunohistochemistry image demonstrating that some pyramidal cells were transduced with NR1 more strongly than others (arrow). Confocal images are from NR1-overexpressing brains, except for an image designated TrkB-control, taken from eGFP-transduced control brain. Overlay images demonstrate that higher TrkB expression colocalizes with NR1 overexpression. G, Representative confocal images of cells transduced with shNR1 vector (green) and TrkB expression (red) within the CA3 region. Overlay demonstrates that shNR1-expressing cells (green arrow) have lower TrkB expression than other cells in which shNR1 is not present (red arrow). F, G, Scale bars, 40 μm. H, Levels of TrkB and BDNF transcripts in eGFP-, NR1-, shdYFP-, and shNR1-injected hippocampi, determined by real-time RT-PCR. The results are the mean ± SEM of three independent experiments. *p < 0.05 (one-way ANOVA).