
Figure 3.
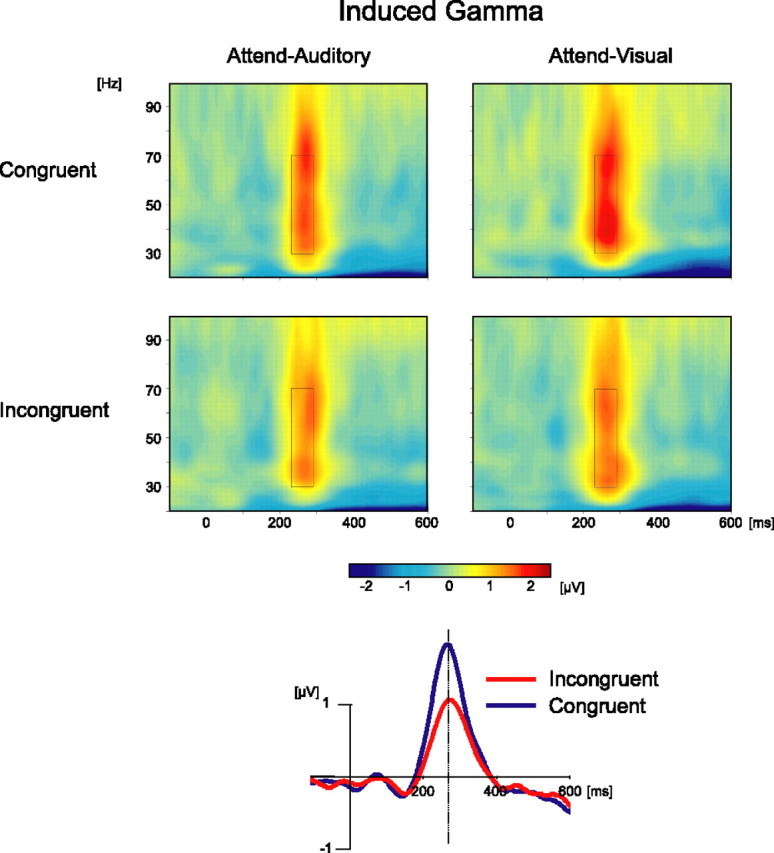
Induced GBR. Top, Time-frequency plots produced by averaging wavelet transformation of single trials. Plots are shown for both tasks and both congruity conditions, collapsed across the usual and unusual picture conditions, which had no effect, and across a cluster of electrodes (Pz, POz, P1, P2, P3, P4, PO3, and PO4). The black rectangle denotes the time × frequency analysis ROI. Note the larger iGBR in congruent than incongruent conditions. Bottom, Induced GBR in congruent and incongruent trials represented by a single wavelet, centered at 40 Hz. The data were collapsed across picture typicality and task, which had no significant effects.