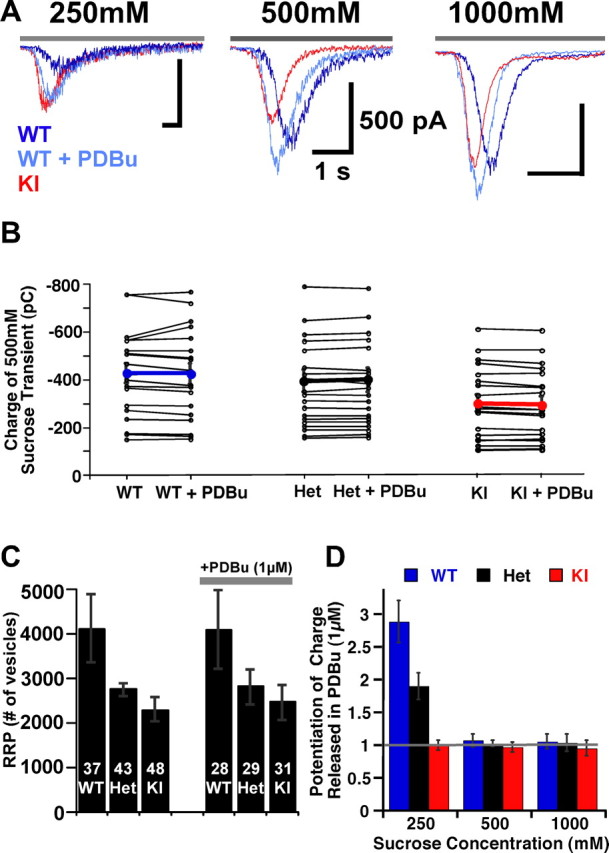
Figure 1.

PDBu-mediated C1 domain activation does not affect the pool size. A, Exemplary raw traces of responses to 250 mm (left), 500 mm (middle), and 1000 mm (right) sucrose pulses in naive and PDBu (1 μm)-treated hippocampal autaptic neurons from Munc13-1 WT (dark blue), WT + PDBu (light blue), and Munc13-1H567K KI (red) mice. Gray bar above each trace indicates the duration of sucrose application. B, Distribution of charge of the inward transient response to a 5 s application of 500 mm sucrose, in the presence and absence of PDBu in 19 individual neurons from WT (left), Het (middle), and KI (right) groups. Thick lines indicate the mean values for WT in blue, Het in black, and KI in red. C, Bar plot showing the mean number of vesicles in the RRP calculated by dividing the charge of the sucrose (500 mm) inward transient by the corresponding mEPSC charge. The number of cells is indicated in white above each corresponding group. Error bars in this and the following figures indicate the SEM. D, Potentiation of response charge during PDBu application at 250, 500, and 1000 mm sucrose stimuli.
