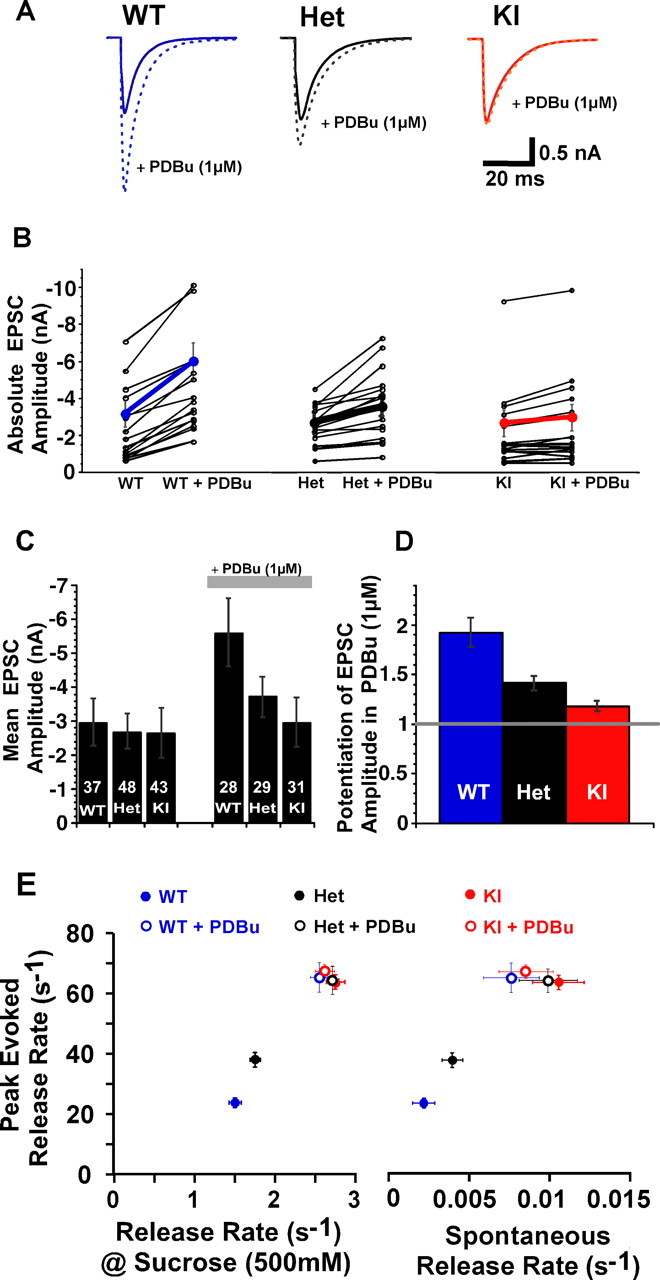
Figure 4.

C1 domain activation increases the rates of all forms of release. A, Exemplary EPSC traces from WT (blue), Het (black), and KI (red) groups and the effect of PDBu (dotted lines). B, Scatter plot of 19 individual neurons. C, D, Bar plots of PDBu-induced potentiation of EPSCs. The absolute amplitudes in naive neurons from the three groups are identical (C, left). E, Correlation of vesicular release rates during all the three forms of release: Ca2+ evoked (y-axis), 500 mm sucrose induced (x-axis, left), and spontaneous (x-axis, right). The peak evoked release rate was calculated by deconvolution of individual EPSC responses by their corresponding mEPSCs after normalizing the EPSC by the RRP of that cell. The osmotically induced release rate was derived from the mean of the maximum slope of 500 mm sucrose response integrals normalized by the corresponding RRP and corrected for by taking into account the fraction of the pool already depleted at the peak of the response. Spontaneous release rate was obtained from the average ratio of the frequency of mEPSCs of each cell to its RRP.
