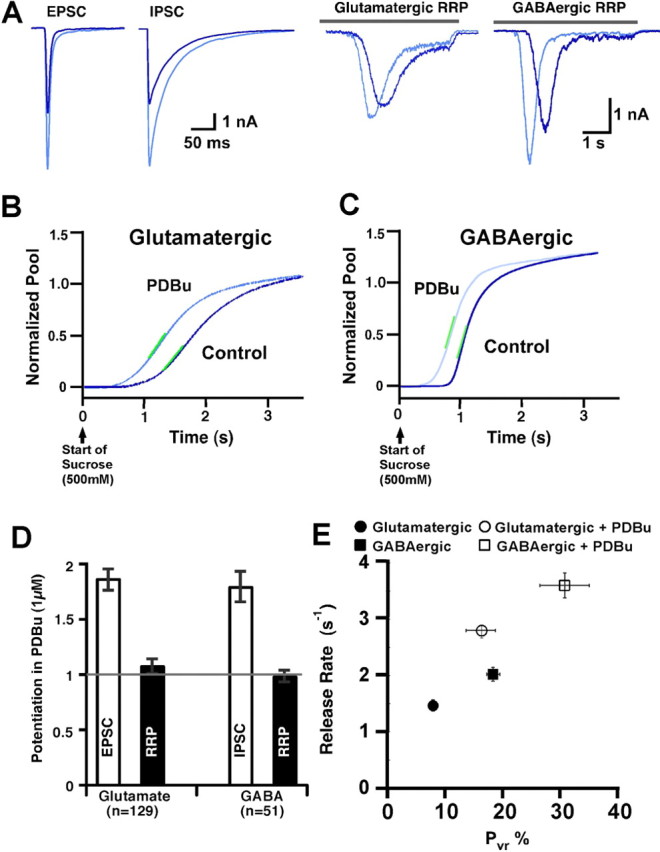
Figure 6.

Comparison of release rates between glutamatergic and GABAergic hippocampal neurons. A, Typical raw traces of evoked (left) and 500 mm sucrose-induced (right) responses from wild-type glutamatergic and GABAergic neurons in the absence and presence of PDBu (1 μm). Average normalized sucrose response integrals from excitatory (B) and inhibitory (C) neurons from control (dark blue) to PDBu-treated (light blue) conditions. Note the faster basal release kinetics in the inhibitory neurons. E, Bar plot of PSC potentiation and the lack of potentiation of RRP in glutamatergic (n = 129) and GABAergic (n = 51) hippocampal neurons. E, Plot correlating the mean peak rate of vesicular release induced by 500 mm sucrose in hippocampal excitatory glutamatergic (circles) and inhibitory GABAergic (squares) autapses as a function of their average Pvr in their naive (filled symbols) and C1 domain-activated (open symbols) states.
