
Figure 4.
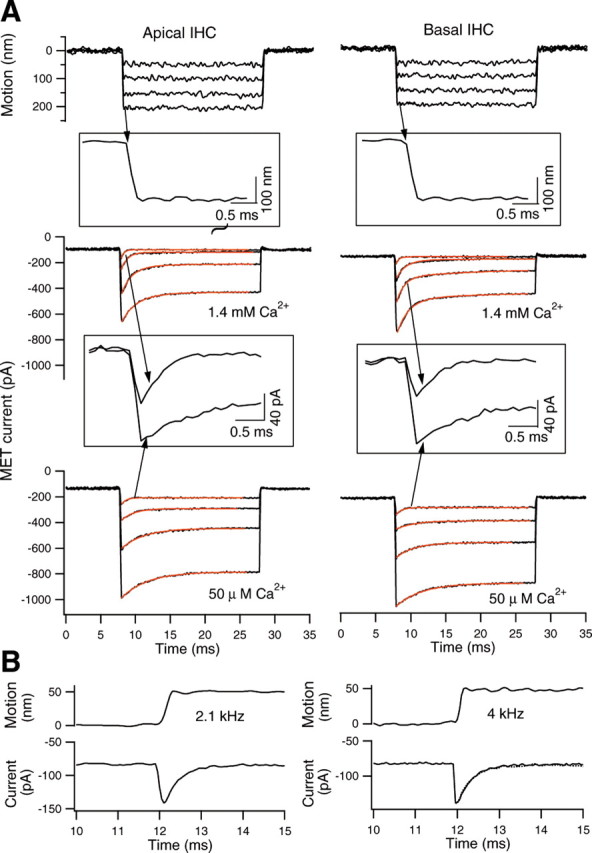
A, Adaptation of the transducer current obtained from apical- and basal-turn IHCs. Glass fiber was loaded onto the top of the TM, and step stimuli with durations of 20 ms were applied. The motion of the fiber (measured by the photodiode technique) is plotted in the top panels. Downward deflections of fiber motions resulted in the downward motion of the TM and thereby deflected the hair bundle in the excitatory direction. The photodiode signal was low-pass filtered at 2.5 kHz. As shown in the inset, the rise time of the step displacement is ∼0.165 ms, corresponding to a cutoff frequency of ∼2.1 kHz. The IHCs were voltage clamped at −70 mV. The current displays rapid activation and adaptation. The adaptation time constants increase from small to large current. Time constants were calculated using a double-exponential fit (red lines). The shorter time constants are 0.41, 0.93, 1.18, and 1.65 ms (apical-turn IHC) and 0.42, 0.83, 1.0, and 1.52 ms (basal-turn IHC), from small to large currents. The time constants significantly increased (response decay slowed down) after the calcium concentration in the bath medium was reduced to ∼50 μm. In the insets, MET currents at the lowest stimulation levels are plotted on expanded time scales to demonstrate the change in magnitude and adaptation of the MET current between the calcium concentrations of 1.4 mm and 50 μm. B, Effect of onset speed (rise time) on the fast time constant of adaptation. The recording was made from a basal-turn IHC. The driving voltage step to the piezoelectric actuator was low-pass filtered with an eight-pole Bessel filter set at either 2.1 or 4 kHz. MET current and TM-loaded fiber motion were measured and plotted on the expanded time scale. The rise times of fiber motion were ∼0.165 and 0.085 ms, respectively. For the sake of comparison, the current response obtained with the low-pass filter set at 2.1 kHz was superimposed (dotted line; only the decay response is plotted) on the response obtained with a 4 kHz cutoff frequency (solid line in the right panel). Note that no significant difference in the current magnitude and adaptation rate was observed with the two different rise times.