
Figure 5.
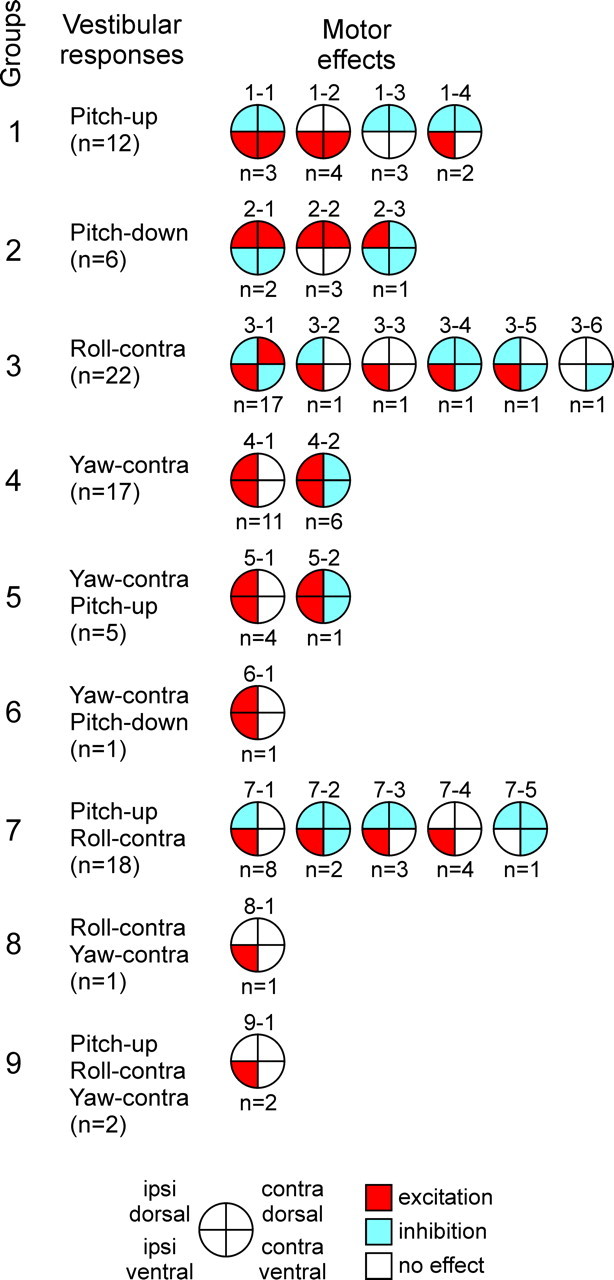
Relationships between vestibular responses and motor effects in individual RS neurons (n = 84). The neurons were grouped according to their inputs (vestibular responses). Groups 1–4 responded to turns in only one plane, groups 5–8 responded to turns in two planes, and group 9 responded to turns in all three planes. For each group, the patterns of motor effects produced by its neurons are shown as circle diagrams, with the quadrants representing the MN pools projecting to the corresponding parts of myotomes. Different colors designate the type of effect (red, excitation; blue, inhibition; white, no effect). Numbers below the diagrams show the number of neurons with a given pattern. contra, Contralateral; ipsi, ipsilateral.