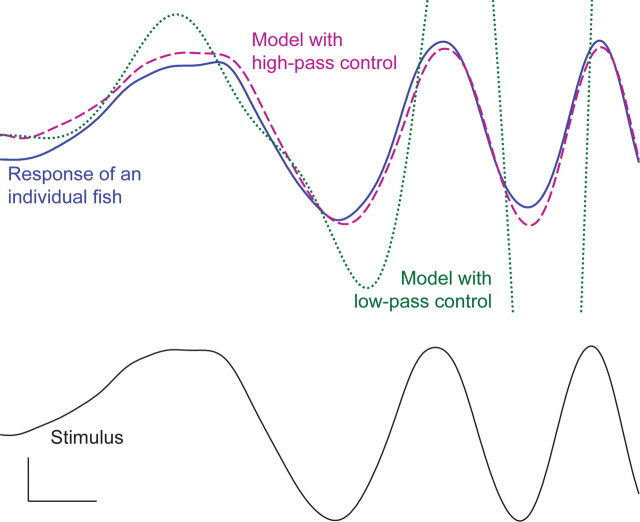
Figure 3.
Stability and performance of the low-pass and high-pass controllers. Plots of the position of the fish over time are shown. The blue curve indicates the response of a fish to the novel increasing frequency stimulus: a frequency chirp. The dotted green curve indicates the unstable performance of the closed-loop model with a low-pass controller. The dashed purple curve demonstrates that the performance of the closed-loop model with a high-pass controller is similar to actual fish performance. Calibration: 1 s, 1 cm.

