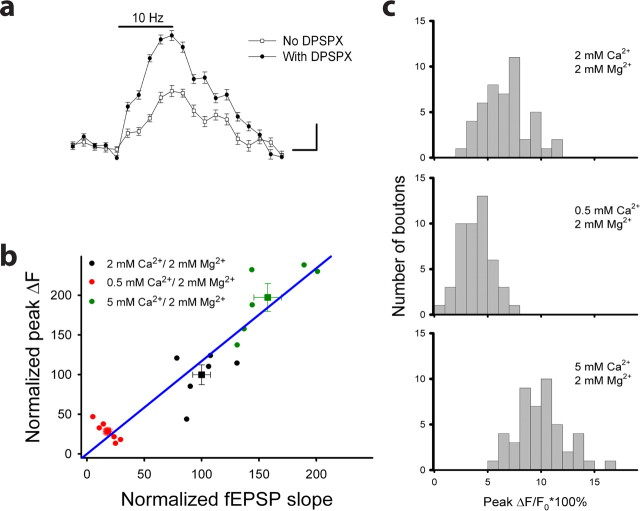
Figure 3.
SpH is the indicator of presynaptic activity. a, The spH fluorescence versus time before, during, and after 10 Hz stimulation in the absence (open squares) or presence (closed circles) of DPSPX (10 μm; 38 boutons, 8 slices). Experiments were done in the presence of 50 μm d-APV. Calibration: vertical, 5%; horizontal, 2 s. b, The spHp as a function of the fEPSP slope in response to 10 Hz (5 s) stimulation measured in solution with normal (black), low (red), or high (green) ratio of Ca2+/Mg2+ (47 boutons, 6 slices). The relationship between changes in spHp and those in the fEPSP slope was fitted as a linear regression function (blue line; ΔspHp(i) = 1/k × (ΔfEPSP slope(i)), where k = 0.89. Squares represent the average of each set of experiments. c, Frequency histogram for spHp of individual boutons from slices in b.

